Designed a Germany-focused EV market-intelligence model that translates public registration, consumer, regional, and charging-infrastructure data into management-ready insights and transparent scenarios.
"The market is no longer explained only by registration volume. The stronger questions are who is switching, where infrastructure is concentrated, and what scale may be required next."
Project type
Independent market-intelligence case
Context
MBA · Automotive & Mobility
Role
Data analyst · Research & dashboard design
Evidence date
Jun 2026 public data cut-off
545,142
2025 BEV registrations - 19.1% share
368,006
H1 2026 BEV registrations - 24.8% share
206,207
Public charge points, 1 June 2026
9.9
BEVs per public charge point (Jan 2026 stock)
31.7k
13.5%
2024
45.4k
19.1%
2025
61.3k
24.8%
H1 2026
01 / 10
DECISION PROBLEM
One evidence chain, not six disconnected tables.
EV market information is distributed across registration tables, charging registers, industry summaries, consumer studies, and policy commentary. A decision-maker can easily see individual facts without understanding how they connect. This project creates one evidence chain from national market movement to customer segments, regional infrastructure, and future scaling requirements.
RESEARCH QUESTIONS
01
Is the 2026 BEV rebound structural, or mainly a short-term correction after the 2024 decline?
02
Which private customer groups are switching to BEVs fastest?
03
How is public charging distributed across federal states and speed categories?
04
Does high infrastructure scale also mean a high fast-charging share?
05
How large could the BEV stock become by 2030 under three transparent paths?
06
What commercial and operating opportunities emerge from the combined evidence?
02 / 10
DATA SOURCES & CREDIBILITY
The evidence register behind the project.
Source
Coverage / date
Use in the model
Kraftfahrt-Bundesamt (KBA)
Registration balances for 2024, 2025, June & H1 2026
Market volume, share, growth and stock
KBA vehicle stock
2m+ BEVs in German stock at 1 Jan 2026
Vehicle-to-charger ratio and scenarios
Bundesnetzagentur
Charging infrastructure & state map, 1 June 2026
Normal points, fast points, power, state mix
HUK-E-Barometer
Q1 2026 private switch data & YouGov survey
Customer-group switching and experience effect
VDIK / ACEA summaries
Market summaries based on KBA H1 2026 data
Cross-check and market context
SOURCE-CONTROL RULES
Every displayed historical number carries a source date or reporting period
Monthly, half-year, annual and stock bases are never mixed without normalisation
Missing data is separated from a true zero
Derived ratios show their numerator, denominator and reference date
Scenario values are visually and verbally separated from historical observations
Credibility boundary: historical market and charging figures come from public sources. The 2030 paths and opportunity matrix are portfolio analyses, not official forecasts.
03 / 10
RESEARCH & DATA WORKFLOW
From public tables to a reproducible market view.
01
Collect public datasets; record source, date, geography, unit
02
Standardise dates, powertrain names, state labels, units
03
Separate registrations, stock, charging points and power into fact tables
04
Remove duplicates; document unavailable or suppressed values
05
Build a calendar table and dimensions for time, geography, segment
06
Calculate reusable measures for volume, growth, share, ratios
07
Validate totals against official reports before publishing
08
Translate the evidence into executive, consumer, regional and scenario pages
PROPOSED DATA MODEL
Table
Key fields
Purpose
Fact_Registrations
Date, powertrain, registrations, customer type
Time-series market growth and share
Fact_Charging
State, normal points, fast points, power, date
Regional infrastructure scale and mix
Fact_Stock
Date, powertrain, vehicle stock
Vehicles per public point and scenarios
Fact_Consumer
Segment, old value, new value, survey response
Switching and barrier analysis
Dim_Date / Dim_State
Calendar and state / region hierarchy
Time intelligence and regional comparison
Scenario_2030
Scenario, growth assumptions, stock path, target ratio
Transparent scenario calculations
04 / 10
ANALYTICAL MODEL & ARCHITECTURE
How the dashboard would be implemented.
The completed whitepaper was produced with Python, public-data research, statistics, and scenario modelling. The dashboard layer is designed for Power BI - this report documents both the completed evidence and the intended interactive implementation, without claiming a final PBIX has already been deployed.
KPI
Formula logic
Decision use
BEV registrations
SUM(BEV registrations)
Market scale
BEV share
BEV registrations / total registrations
Adoption within total market
YoY growth
Current period / previous period − 1
Momentum
Public charge points
Normal points + fast points
Infrastructure scale
Fast-charging share
Fast points / all public points
Charging-speed mix
BEVs per public point
BEV stock / public charge points
Infrastructure pressure indicator
Scenario gap
Required points − current public points
Illustrative expansion requirement
DASHBOARD PAGES
Page
Core content
Executive overview
Registrations, share, YoY growth, monthly trend, stock, data date
Consumer adoption
Private switching by age, housing access, EV experience, barriers
Infrastructure atlas
State map, total points, fast points, power, concentration
Regional structure
Scale versus fast-charging intensity and regional archetypes
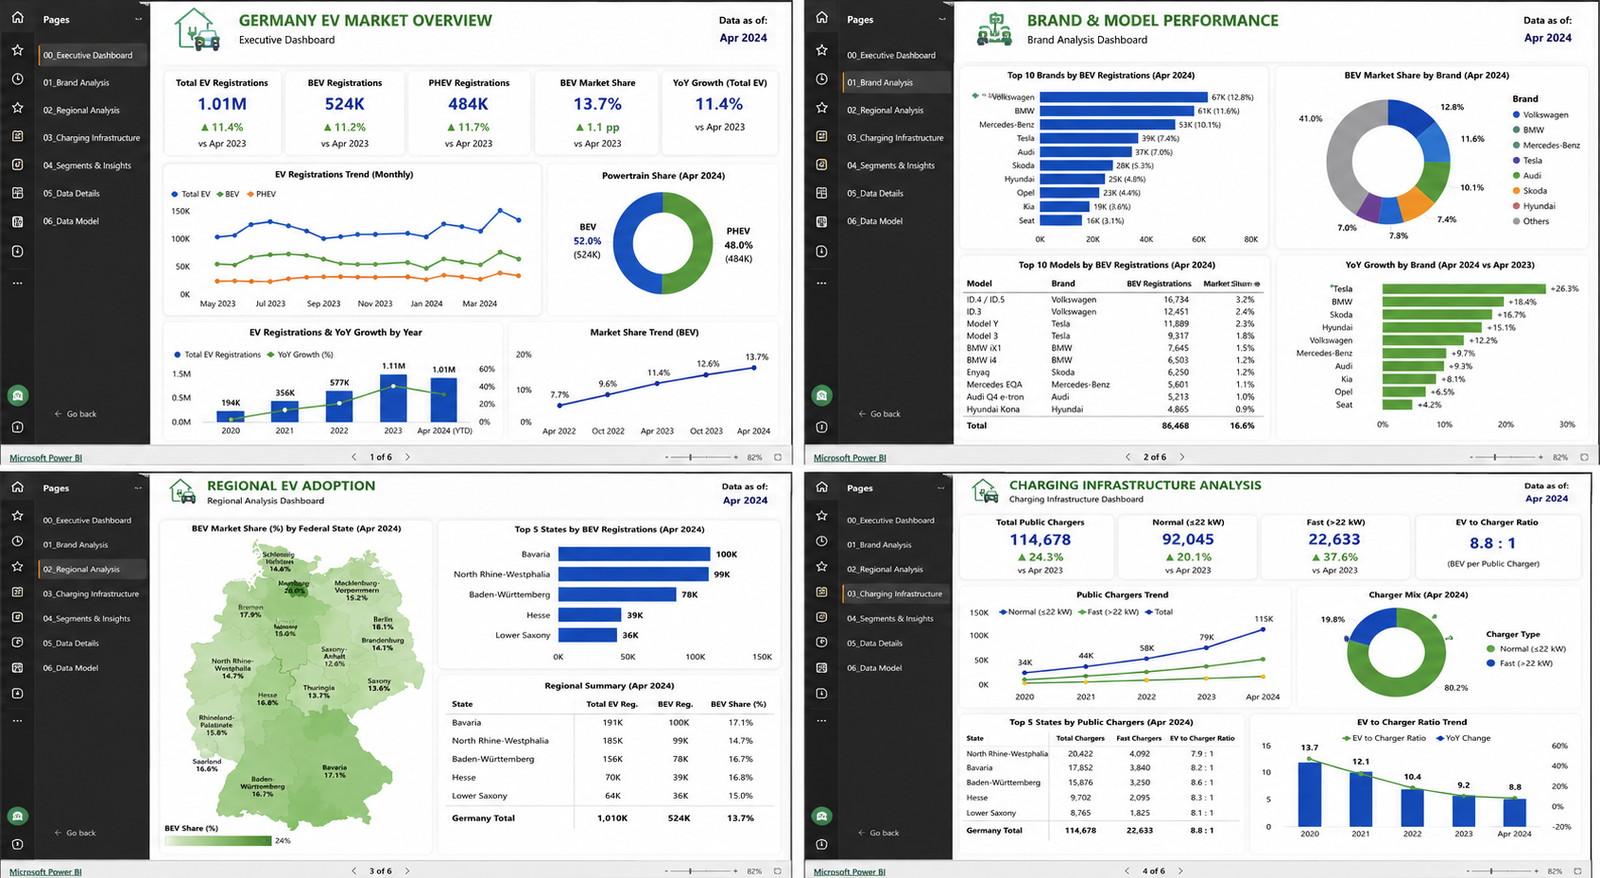
Executive overview, brand & model performance, regional EV adoption and charging-infrastructure analysis - built on the same KPI catalogue and data model documented above. Blue marks market and volume measures; green marks BEV, powertrain and charging-specific measures, the same convention used throughout this page.
Data as of Apr 2024 in this dashboard build. Executive Dashboard, Brand & Model Performance, Regional EV Adoption, Charging Infrastructure Analysis.
06 / 10
MARKET INFLECTION & CONSUMER ADOPTION
Germany's BEV market entered a second growth phase.
The monthly BEV run rate nearly doubled between 2024 and the first half of 2026. The share increase is equally important: growth was not only caused by a larger total car market - BEVs captured a materially larger part of new registrations.
2025
545,142
19.1% share · +43.2% YoY
H1 2026
368,006
24.8% share · +48.0% YoY
June 2026
84,057
28.4% share · +78.2% YoY
PRIVATE SWITCHING (2025 AVG → MAR 2026)
All private switches: 5.5% → 8.9%
Drivers under 40: 4.0% → 7.8%
No garage / carport: 3.6% → 6.3%
Renters: 2.2% → 4.1%
Private adoption accelerated most in previously price-sensitive segments - drivers under 40, renters, and people without a garage or carport.
07 / 10
INFRASTRUCTURE ATLAS & REGIONAL STRUCTURE
206,207 public charging points - but not one uniform market.
Official distribution of normal and fast charging by federal state, 1 June 2026. Scale and fast-charging intensity are different strategic dimensions: a state can have many charging points but a relatively low share of high-speed capacity.
152,915
Normal charging points, 1 June 2026
53,292
Fast-charging points - 25.8% of public points
8.87 GW
National simultaneous public charging capacity
9.9
BEVs per public point (2.034m BEV stock, Jan 2026)
Concentration signal: North Rhine-Westphalia, Bavaria, Baden-Württemberg and Lower Saxony account for approximately 65.7% of all public charging points - infrastructure scale is strongly concentrated in the largest vehicle markets.
Regional archetype
Examples
Strategic question
High scale / high fast intensity
Bavaria, NRW, Lower Saxony
Protect corridor capacity; manage utilisation
High scale / lower fast intensity
Baden-Württemberg
Increase the fast-charging mix
Lower scale / high fast intensity
Thuringia, Saxony-Anhalt, MV, RP
Improve coverage and site economics
Urban dense / lower fast intensity
Berlin, Hamburg
Focus on curbside, hubs and fleet charging
08 / 10
SCENARIO LAB & STRATEGIC WHITE SPACES
How large could the BEV stock become by 2030?
Three transparent growth paths starting from 2.034 million BEVs at 1 January 2026. This is not a prediction - each scenario applies a declining annual growth path, and the charging requirement holds the current national ratio near ten BEVs per public point.
Scenario
2030 BEV stock
Points needed (10 BEVs/point)
Additional points
Conservative
3.91 million
391k
185k
Base (most likely)
5.05 million
505k
299k
Accelerated
6.19 million
619k
413k
Assumptions: conservative annual growth declines from 18% to 10%; base from 24% to 16%; accelerated from 30% to 20%.
FOUR OPPORTUNITIES FROM THE COMBINED EVIDENCE
01
Affordable and used EVs
Evidence: private switching accelerated most in price-sensitive groups; a used-EV market can extend adoption beyond new-car buyers.
Action: build transparent battery-health, financing and residual-value propositions.
02
Urban renters & no-home-charging users
Evidence: renters and drivers without a garage grew fastest in relative terms, but absolute adoption remains below average.
Evidence: large charging networks do not always have a high fast-charging share; network design should reflect travel patterns.
Action: use utilisation, dwell time and corridor demand to decide where fast capacity creates value.
04
Experience-led conversion
Evidence: consumers with prior EV experience respond more strongly to incentives than those with none.
Action: scale test drives, short-term subscriptions and employer / fleet exposure as adoption channels.
09 / 10
TOOLS, SKILLS & WHAT THIS DEMONSTRATES
What this project demonstrates.
Python / pandasMatplotlibStatisticsScenario modellingExcelPower BI architecturePower Query / DAXPublic-data research
Automotive market research & evidence synthesis
Convert public registration, consumer, regional and infrastructure data into one structured decision view.
Public-data validation & source-date discipline
Every headline number carries a source date; different reporting bases are never mixed without normalisation.
Regional infrastructure analysis & derived ratios
Vehicle-to-charger ratios, fast-charging mix and concentration signals by federal state.
Power BI architecture, KPI design & executive storytelling
A reusable KPI catalogue, DAX blueprint and dashboard-page design ready for native implementation.
10 / 10
CREDIBILITY & SCOPE
Independent market-intelligence case study
Self-directed automotive and mobility analytics project - not commissioned by an OEM, charging operator, or public authority. Historical market and infrastructure figures are sourced from public datasets with explicit dates; 2030 stock and infrastructure values are analytical scenarios, not official forecasts. The completed whitepaper uses Python, statistics, public-data research and scenario modelling; this page also documents the intended Power BI dashboard architecture and DAX layer without claiming a native PBIX has already been deployed.
Limitations: the project uses public aggregate data and does not include private charging, utilisation, reliability, queueing, site economics or grid-upgrade requirements. Consumer results come from the published HUK study and survey context and should not be generalised beyond the stated evidence.
Go beyond the overview. Explore the complete project documentation, process, and supporting files on GitHub.