Portfolio
Selected work,
in detail.
Case studies from operations, product strategy, analytics and engineering - browse the list below, then read each case study in full further down the page.
← Back to Home
Case Study 02 / 12
Manufacturing Operations Strategy · Independent Case Study · 2025
Independent case study - not an official Tesla project
NPI-OS: Gigafactory Bottleneck & Tier Escalation Framework
A closed-loop operating model for identifying, escalating, resolving, and preventing high-impact manufacturing issues during production ramp-up.
Modelled Impact
Simulated period used to pressure-test the framework end-to-end, from issue capture to verified closure.
83.6%
Action effectiveness
Context
Created for Tesla-relevant interview and portfolio preparation - not an official Tesla assignment. During a production ramp, issues appear faster than teams can fully investigate them. A local equipment stop can quickly become a quality, material, or output risk. The core problem is often not issue detection; it is unclear ownership, slow escalation, inconsistent priority rules, and weak closure evidence.
Research Questions
How should issues be classified so the right team responds quickly?
When should a local issue move to department or site leadership?
Which KPIs reveal repeat losses rather than only daily symptoms?
What evidence is required before an issue is considered closed?
Design Assumptions
High-volume EV manufacturing environment with interconnected processes and supplier dependencies
Issues may originate in equipment, material, quality, labour, engineering change, or process balance
The model must support daily operating decisions, not only retrospective reporting
All data shown in the portfolio is simulated and anonymised
Bottleneck Taxonomy
Nine categories classify recurring factory issues in the modelled 142-issue population, ranked by volume in the issue log:
Equipment Downtime - 38 issues · breakdown, micro-stop, unstable cycle time
Material Shortage - 27 issues · part shortage, incorrect sequence, low lineside coverage
Quality Defect - 24 issues · defect spike, first-pass-yield drop, rework queue
Cycle Time / Line Balance - 17 issues · takt loss, uneven workstation loading
Supplier Delay - 12 issues · late delivery, capacity gap, transport disruption
Rework - 9 issues · fit & finish, dimensional deviation
Engineering Change - 8 issues · late spec/BOM/process update
Labour / Manpower - 5 issues · training gap, staffing imbalance
Other - 2 issues · uncategorised or cross-cutting causes
NPI-OS Control Architecture
A closed-loop operating model for detecting, escalating, resolving, and preventing manufacturing bottlenecks across seven lifecycle stages. The system separates immediate containment from permanent correction - an issue is closed only after effectiveness is verified.
1. Detect - abnormal condition, downtime, shortage, quality escape
2. Contain - protect safety, quality, and line continuity
3. Classify - category, severity, urgency, recurrence, production impact
4. Route - assign owner and escalation tier
5. Resolve - root cause, countermeasure, due date, evidence
6. Validate - confirm effectiveness and prevent repeat
7. Standardise - update process, control plan, lesson learned
Decision layer - the five control surfaces that make the loop operable day-to-day:
Issue RegisterSingle source of truth
Tier RulesWho decides and when
KPI DashboardTrend and exception visibility
Root-Cause ReviewRepeat issue prevention
Action GovernanceOwner, due date, closure proof
Executive Control Dashboard
The dashboard is designed as an operations control page. It combines current issue load, production impact, escalation tier, responsible function, ageing, resolution performance, and equipment effectiveness in one view.
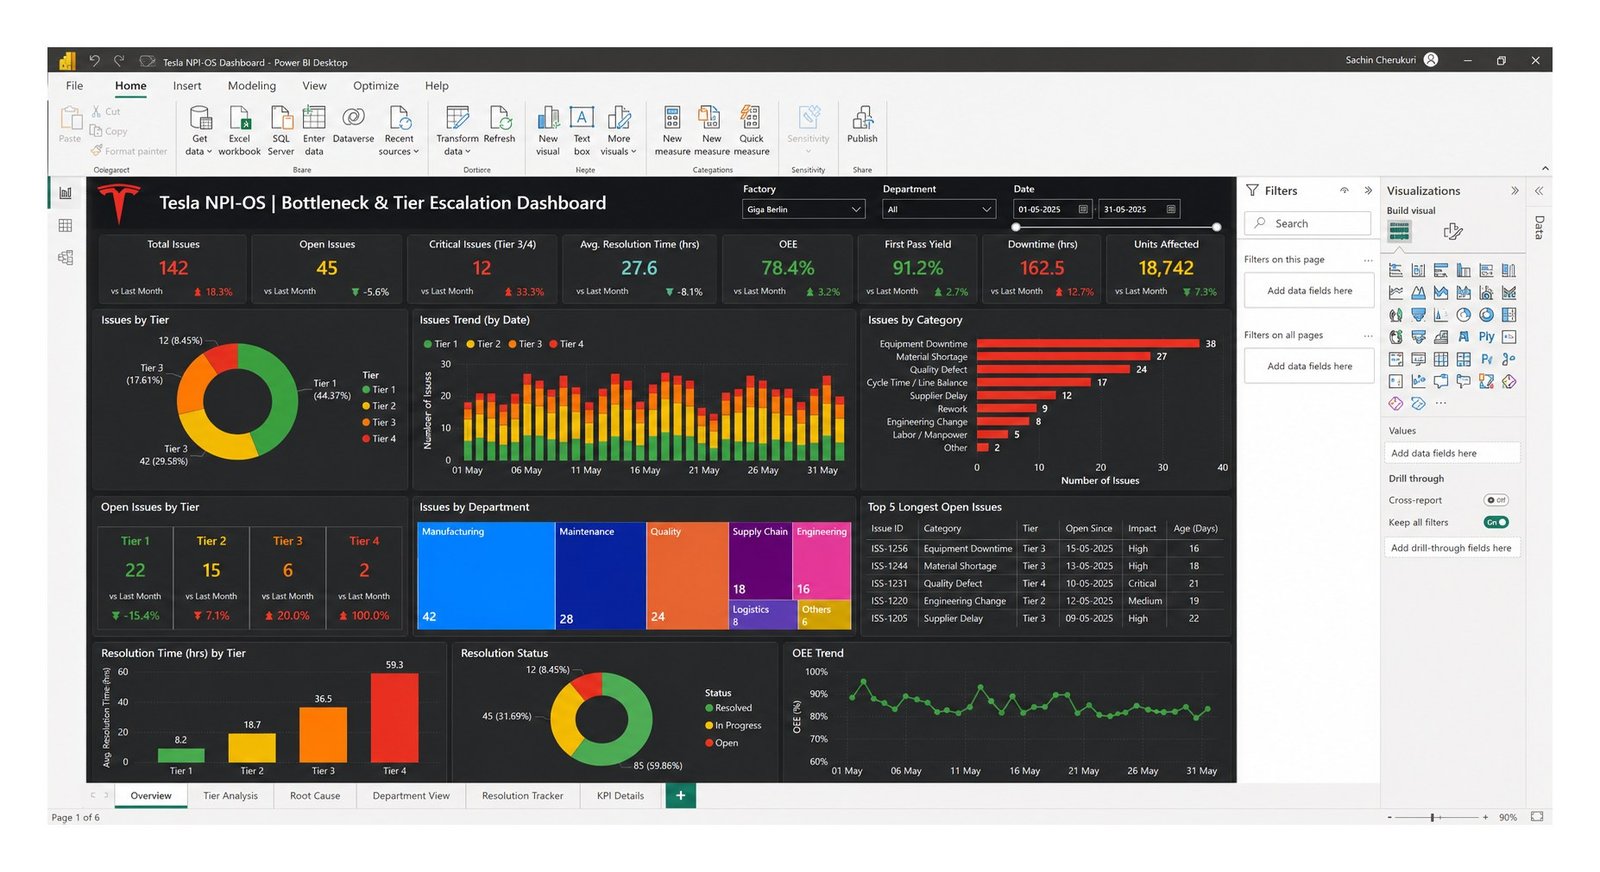
Power BI-style portfolio mock-up. Values are tied to the simulated Excel issue register.
Decision questions the page is built to answer:
Where is the largest production loss occurring?
Which functions own the current critical issues?
Are Tier 3 and Tier 4 issues increasing or decreasing?
Which issues have remained open beyond the response target?
Escalation Logic - Tier Model
Tier level is determined by severity, cross-functional impact, and the authority needed to remove the blocker - not only by how long an issue has been open.
Tier 1
Line / Area
Owner: team lead or supervisor. Response: immediate containment. Trigger: local issue, low impact, known countermeasure.
Tier 2
Department
Owner: Engineering / Quality / Maintenance lead. Response: < 4 hours. Trigger: cross-functional support or repeated local issue.
Tier 3
Site Leadership
Owner: Operations leadership. Response: < 12 hours. Trigger: output, launch, quality, or delivery risk.
Tier 4
Strategic / Executive
Owner: Senior leadership. Response: < 24 hours. Trigger: capacity, investment, supplier, or programme decision.
Severity score - Priority Score = Production Impact (30%) + Safety (25%) + Quality (20%) + Duration (15%) + Recurrence (10%)
| Score range | Resulting tier |
|---|
| 0 – 39 | Tier 1 |
| 40 – 59 | Tier 2 |
| 60 – 79 | Tier 3 |
| 80 – 100 | Tier 4 / strategic review |
Example issue walkthrough
Detect: repeated press stoppage reduces hourly output
Contain: maintenance resets the line and protects downstream flow
Classify: high production impact plus recurrence creates a Tier 3 score
Assign: maintenance owns technical cause; operations owns output recovery
Validate: issue closes only after stable production and no repeat failure
Data Foundation
The model uses one record per issue. This creates traceability from the original event to the final corrective action and allows consistent filtering by department, category, severity, tier, status, owner, and date.
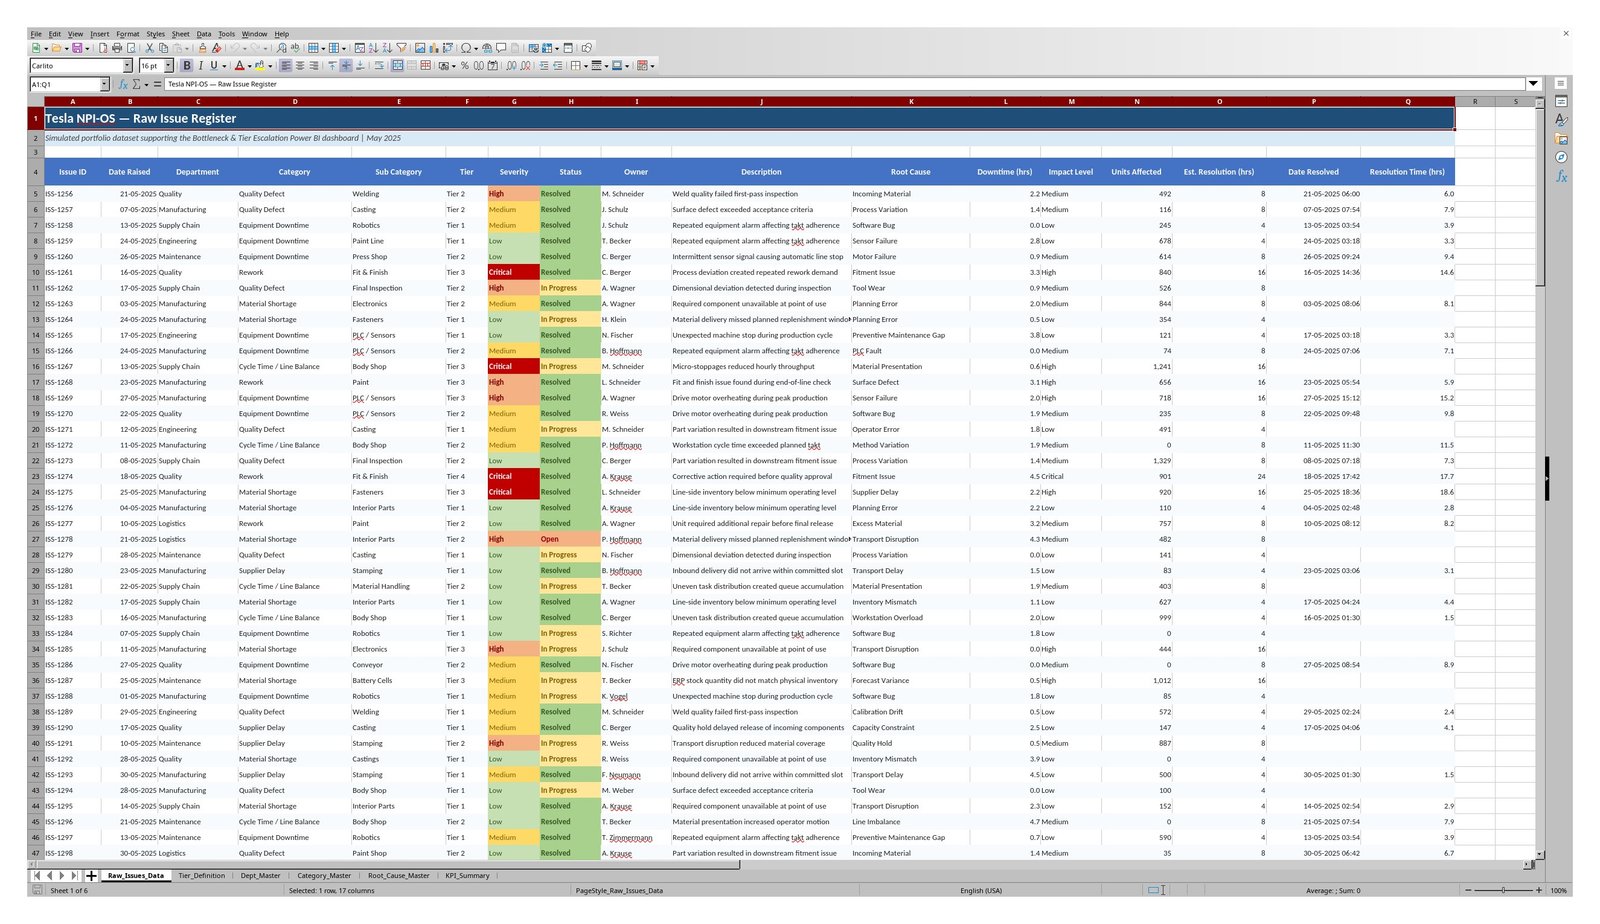
Actual spreadsheet render of the simulated issue register used as the dashboard data source.
Key data fields: Issue ID, date raised, department, category, sub-category, tier, severity, status, owner, description, root cause, downtime, units affected, target resolution, resolved date, and actual resolution time.
Mandatory owner, category, severity, and status fields
Standardised tier and root-cause master lists
Date checks for resolution and overdue calculations
Conditional formatting for critical severity and open status
Root Cause & Corrective Action
The root-cause page shifts the discussion from how many issues occurred to why they occurred, how often they repeated, how long they took to resolve, and whether corrective actions were effective. A Pareto view highlights the small number of categories responsible for most disruption: Equipment (46 issues, 32.4%), Material (31, 21.8%), Quality (24, 16.9%), Process (21, 14.8%), Supplier (12, 8.5%), Engineering (6, 4.2%), and other causes (2, 1.4%).
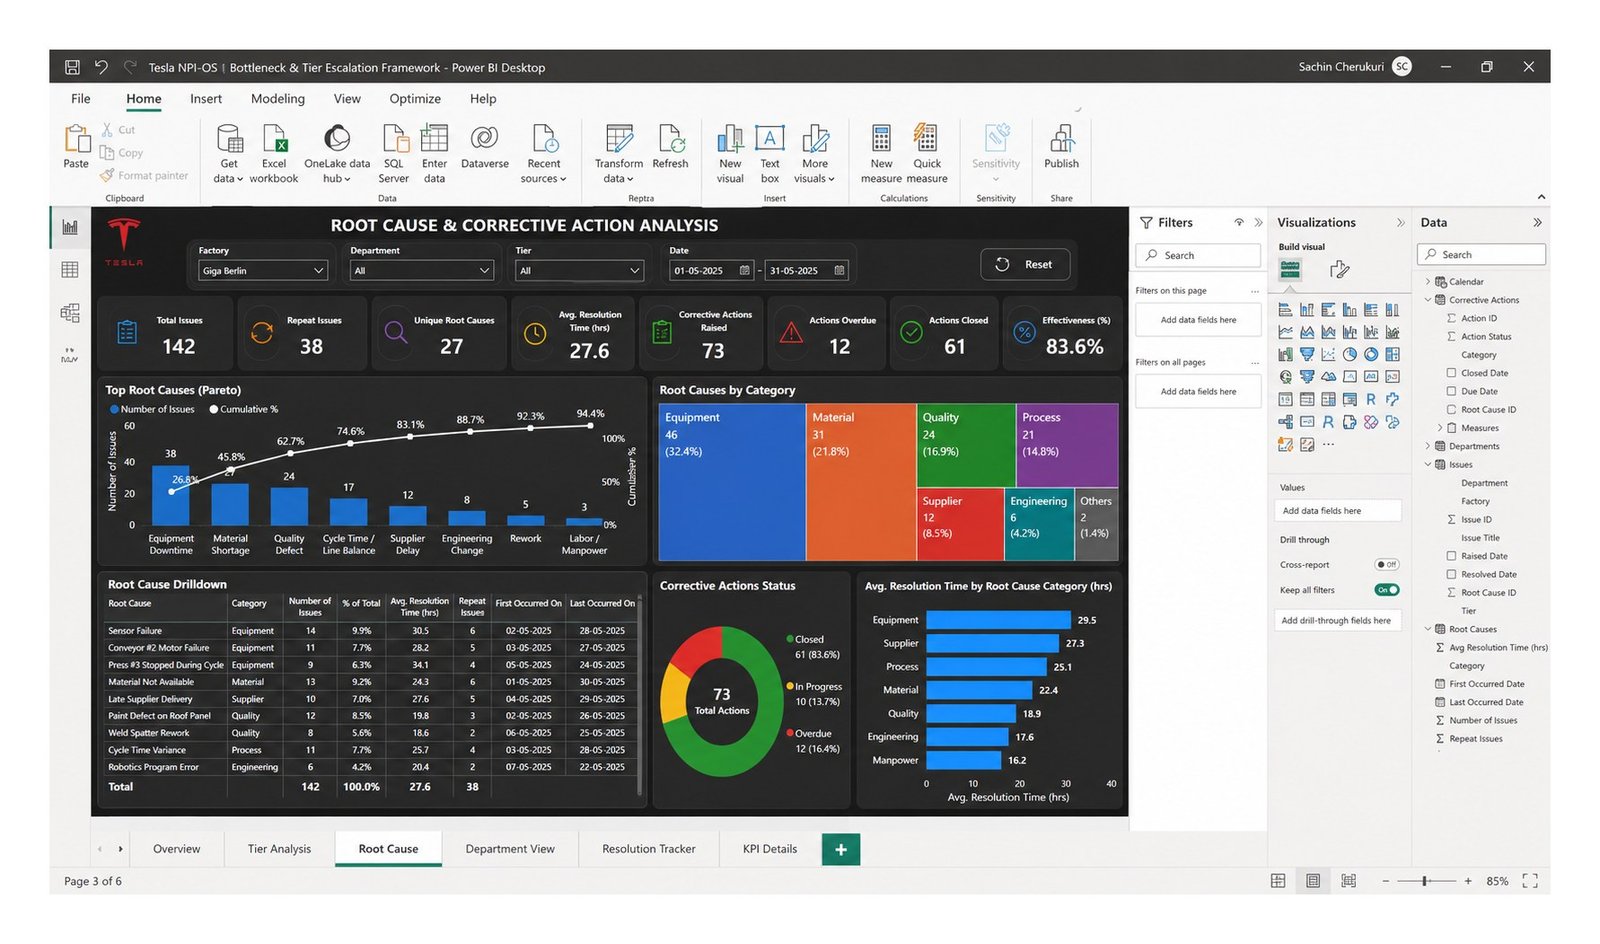
Root-cause and corrective-action dashboard mock-up using the same simulated issue population.
Closure standard - an issue is only marked resolved once every condition below is met:
Containment completed and production risk controlled
Root cause supported by evidence, not assumption
Corrective action assigned with an owner and due date
Effectiveness verified through stable performance or no recurrence
Learning reflected in SOP, maintenance plan, supplier control, or training
Governance & Management Rhythm
The dashboard works only when decisions happen on time. Each review level has a defined owner, agenda, decision output, and escalation trigger - moving issues from local containment to site-level decisions without losing ownership.
Shift Start - Line readiness checkSupervisor · safety, material, equipment, staffing
Tier 1 - Area huddleTeam lead · new issues, containment, owner assignment
Tier 2 - Functional reviewFunction lead · engineering support, root cause, action plan
Tier 3 - Daily site reviewOperations leadership · critical blockers, output risk, trade-offs
Weekly - Performance reviewSite leadership · repeat issues, ageing actions, KPI trends
Monthly - Governance reviewSenior management · systemic causes, standards, investment
Line teams own immediate containment. Functional teams own technical resolution. Site leadership resolves cross-functional trade-offs. Senior management becomes involved only when the issue requires capacity, investment, supplier, or programme decisions.
Ageing actions reviewed against response targets
Repeat issues cannot be closed as isolated events
Critical issues require daily status and recovery confidence
Overdue actions automatically move to the next review level
Tools & Methods
ExcelPower BI conceptsOEEFirst-pass yieldPareto analysis5 WhysRACIIssue ageingTier managementCorrective-action trackingExcel data modelling
Credibility Boundary
This is an independent portfolio case study based on public manufacturing principles and simulated data. It was not commissioned by, conducted inside, or endorsed by Tesla. The dashboard images are portfolio mock-ups; the Excel issue register is a real generated workbook using simulated records.
Findings, Boundaries & Portfolio Value
1
Integrated operating model
"Escalation speed improves when priority rules are transparent and ownership is assigned at issue creation. Closure rate alone is insufficient - repeat frequency, action effectiveness, and process stability are needed to confirm that the loss has actually been removed."
What this proves
- Manufacturing-operations and NPI thinking
- KPI design linked to real decisions
- Root-cause and corrective-action governance
- Power BI and structured Excel data concepts
- Cross-functional escalation and management cadence
- Ability to communicate complex factory logic clearly
How it applies in real environments
- Shorter escalation latency to the correct decision level
- Clearer ownership for cross-functional issues
- Better visibility of ageing, repeated and high-impact bottlenecks
- Stronger link between issue closure and evidence-based validation
Designed a closed-loop NPI operating system for high-volume manufacturing. The framework combines structured issue capture, impact-based tier escalation, KPI monitoring, root-cause analysis, corrective-action governance, and a daily management rhythm to move bottlenecks from detection to verified closure.
Case Study 03 / 12
Process & ERP Governance · Industrial-Academic Project · 2026
Manufacturing KPI & Performance Control Model - IFS ERP and 2c8
Designed a process-to-KPI control model that links operational workflows, ERP data sources, metric ownership, reporting cadence and management decisions.
Modelled Baseline
Baseline figures from the simulated dataset used to pressure-test the control design before-and-after comparison.
91.7%
On-time completion · target ≥95%
45
Open operational items · target <25
94.2%
Data quality completeness · target ≥98%
"A process should not only be reported. It should be sensed, compared with limits, and corrected."
Business Problem
Operational reporting becomes difficult when process steps, system data and management KPIs are documented separately - a number can appear on a report without a clear definition, owner, source field, calculation rule or action threshold. The project builds traceability from the business process to the KPI, and from the KPI to the management decision.
Project question: How can manufacturing data be converted into a control system that distinguishes normal variation from real risk, assigns ownership, and closes the loop through verified corrective action?
Methodology
Process discovery - workflows, stakeholders, hand-offs, control points
Process mapping - activities, decisions, inputs/outputs, systems (2c8 / SIPOC)
Data mapping - IFS source transactions, fields, master data, data-quality risks
KPI design - formula, purpose, owner, frequency, target, action threshold
Governance - RACI and review/decision cadence
Visualisation - Excel/Power BI dashboard concept
Control Logic - A Feedback-Control Problem
The project was designed around a closed loop, not a one-way dashboard. Traditional reporting tells management what happened; a control model must also define the expected condition, detect meaningful deviation, trigger the right response, and verify that the response worked.
1
Process Event
Production order, maintenance task, quality check
2
ERP Signal
Timestamp, status, owner, quantity
3
Validation
Mandatory fields, master data, time logic
4
Control Logic
KPI formula, control limit, exception rule
5
Management Action
Assign, escalate, correct, close
Feedback: verified corrective action changes the process rule, ownership, or operating method - closing the loop back to Process Event.
Five design rules:
A KPI definition is fixed before any visual is built
The ERP transaction is the signal; data quality is part of the control system
Targets are separated from statistical control limits
Every exception has one accountable owner and one response time
An action is closed only after the KPI confirms effectiveness
Statistical Process Control
Averages alone can hide an unstable process. The chart below plots engineering approval cycle time against statistical control limits rather than the target alone.
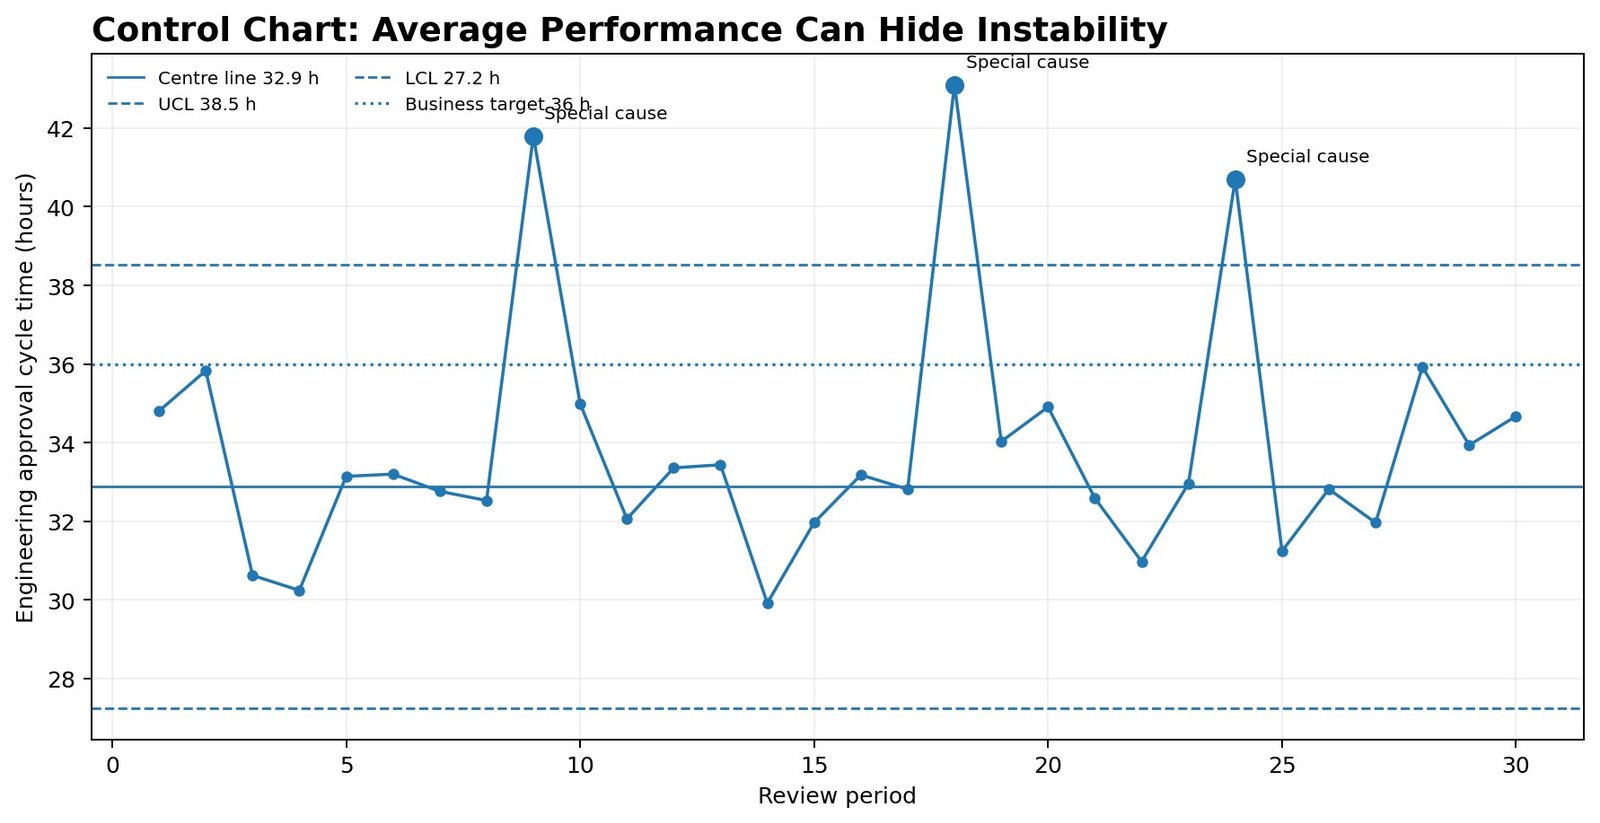
Simulated control chart. Three points breach the upper control limit - special-cause variation that would be hidden by the average alone.
Interpretation: the average approval cycle sits close to the business target, but three observations breach the statistical upper control limit. These are not normal fluctuations - they require root-cause investigation before the process is judged by its average.
| Signal | Meaning | Management response |
|---|
| Point outside control limit | Special-cause variation | Contain, investigate, document cause |
| Target miss inside control limits | Stable but poorly centred process | Redesign the process or target |
| Trend or run on one side | Gradual shift | Review workload, method, or data definition |
Process Capability
A process can meet the target on average and still fail too often because variation is too wide - so the model monitors standard deviation and capability, not only the mean.
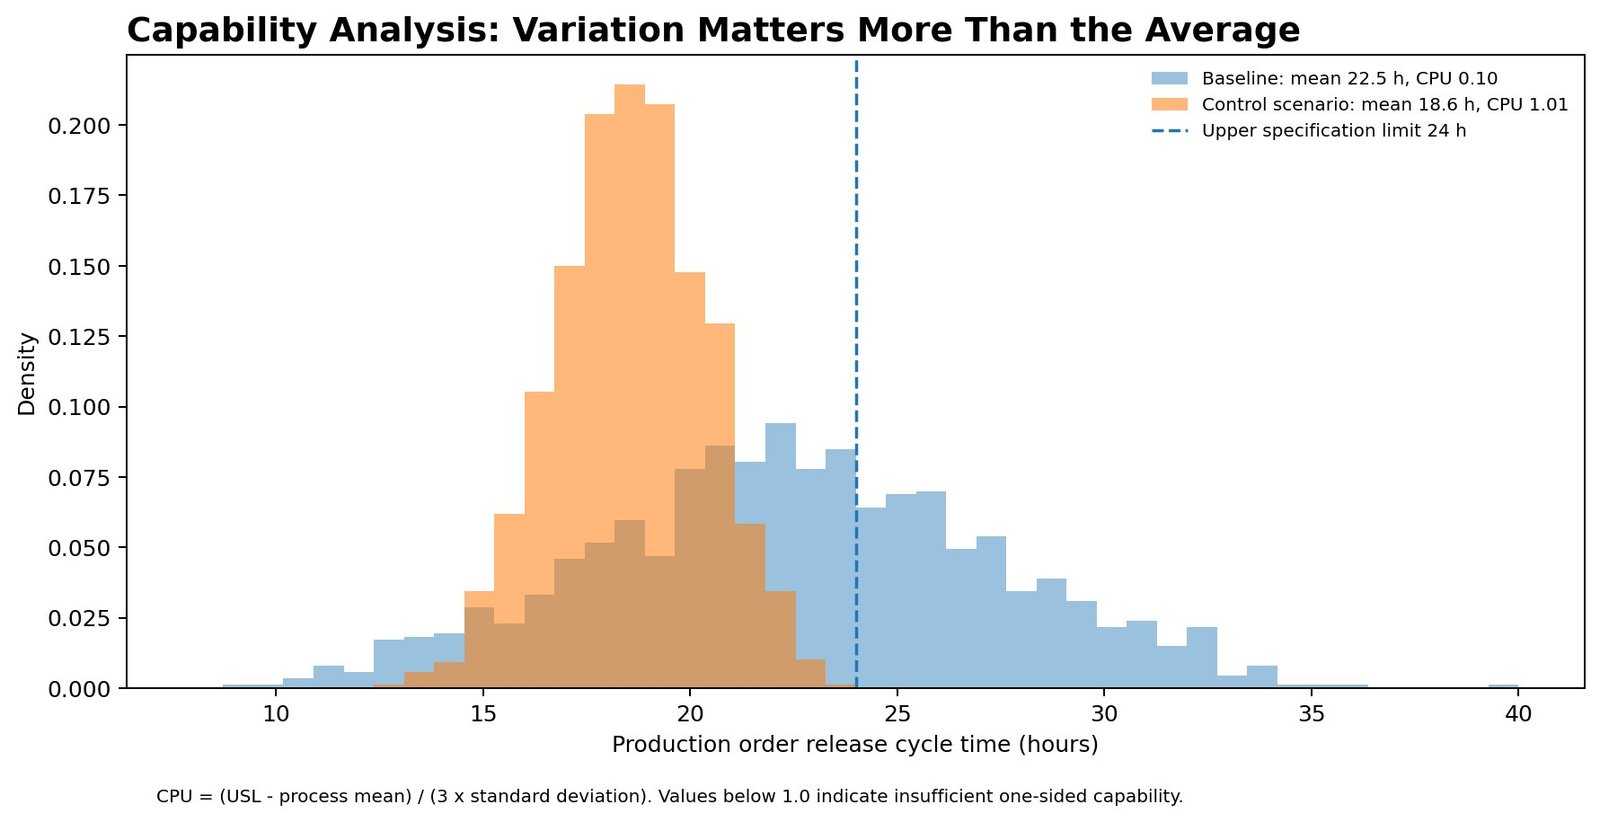
Simulated capability analysis. CPU = (USL − process mean) / (3 × standard deviation); values below 1.0 indicate insufficient one-sided capability.
0.10
Baseline one-sided capability · unstable
1.01
Control-scenario capability · near minimum acceptable
24h
Upper specification limit · production-order release
Control action tested: standard approval path, mandatory data fields before submission, workload visibility, and automatic escalation of ageing records.
KPI Definition Standard
| Field | Required Definition |
|---|
| KPI name | Clear business language without ambiguous abbreviations |
| Business purpose | The decision or behaviour the KPI should support |
| Formula | Numerator, denominator, filters and time logic |
| Data source | IFS module, report, transaction or master-data field |
| Owner | Role accountable for accuracy and action |
| Frequency | Real time, daily, weekly or monthly |
| Target/threshold | Expected range and escalation level |
| Action rule | What happens when performance moves outside the threshold |
Causal KPI System Design
The purpose of a leading indicator is to explain and influence a lagging result - so the catalogue is built as a causal system, not a flat KPI list.
| Layer | Examples | Decision use |
|---|
| Leading controls | Data completeness, PM closure, supplier response | Act before the result deteriorates |
| Process behaviour | Cycle stability, material availability, item ageing | Locate the mechanism causing loss |
| Operational outcomes | On-time completion, compliance, throughput stability | Judge business performance |
Design rule: a lagging KPI should have at least one controllable leading indicator and one named owner.
KPI Catalogue & Ownership Matrix
Ten KPIs span leading, process and outcome layers, each with a business definition, calculation logic, data source, target/warning/critical bands, frequency, owner and escalation rule.
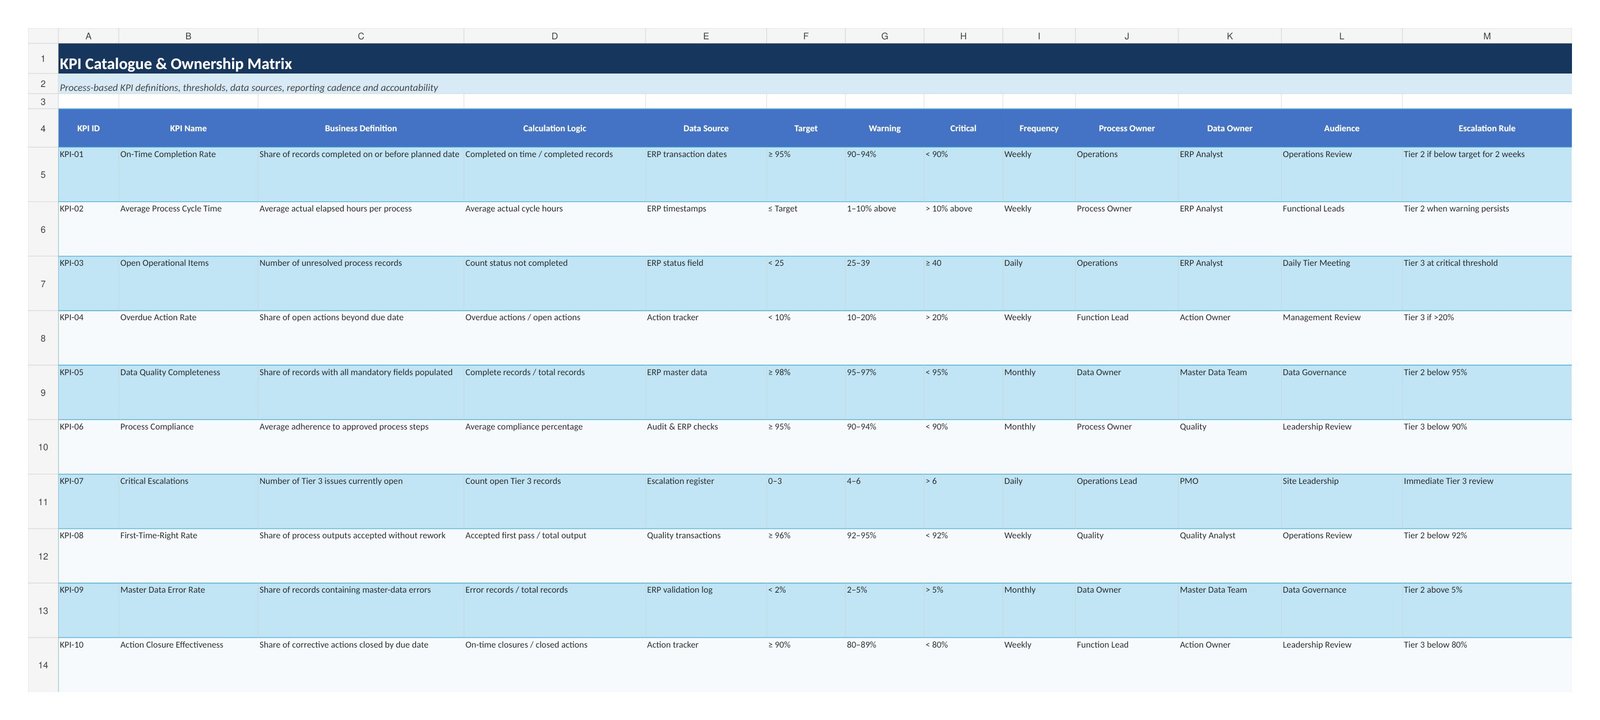
Simulated KPI catalogue and ownership matrix - the control constitution referenced by every dashboard and management review.
KPI-01 On-Time Completion Rate - target ≥95%
KPI-02 Average Process Cycle Time - target ≤ process target
KPI-03 Open Operational Items - target <25
KPI-04 Overdue Action Rate - target <10%
KPI-05 Data Quality Completeness - target ≥98%
KPI-06 Process Compliance - target ≥95%
KPI-07 Critical Escalations - target 0–3 open
KPI-08 First-Time-Right Rate - target ≥96%
KPI-09 Master Data Error Rate - target <2%
KPI-10 Action Closure Effectiveness - target ≥90%
Information Flow
Operational eventoccurs on the shop floor / in a process step
IFS ERP transaction / statuscaptures the event
Validation & transformationdata-quality checks
KPI calculationper the KPI catalogue
Role-specific dashboardreviewed in management meeting
Corrective actionwith follow-up evidence
Implementation - ERP Data Contracts
The control system only works when each field, formula, owner, and review cadence is explicit. The source register captures planned and actual dates, cycle time, data quality, compliance, open action, action owner, due date, and escalation tier.
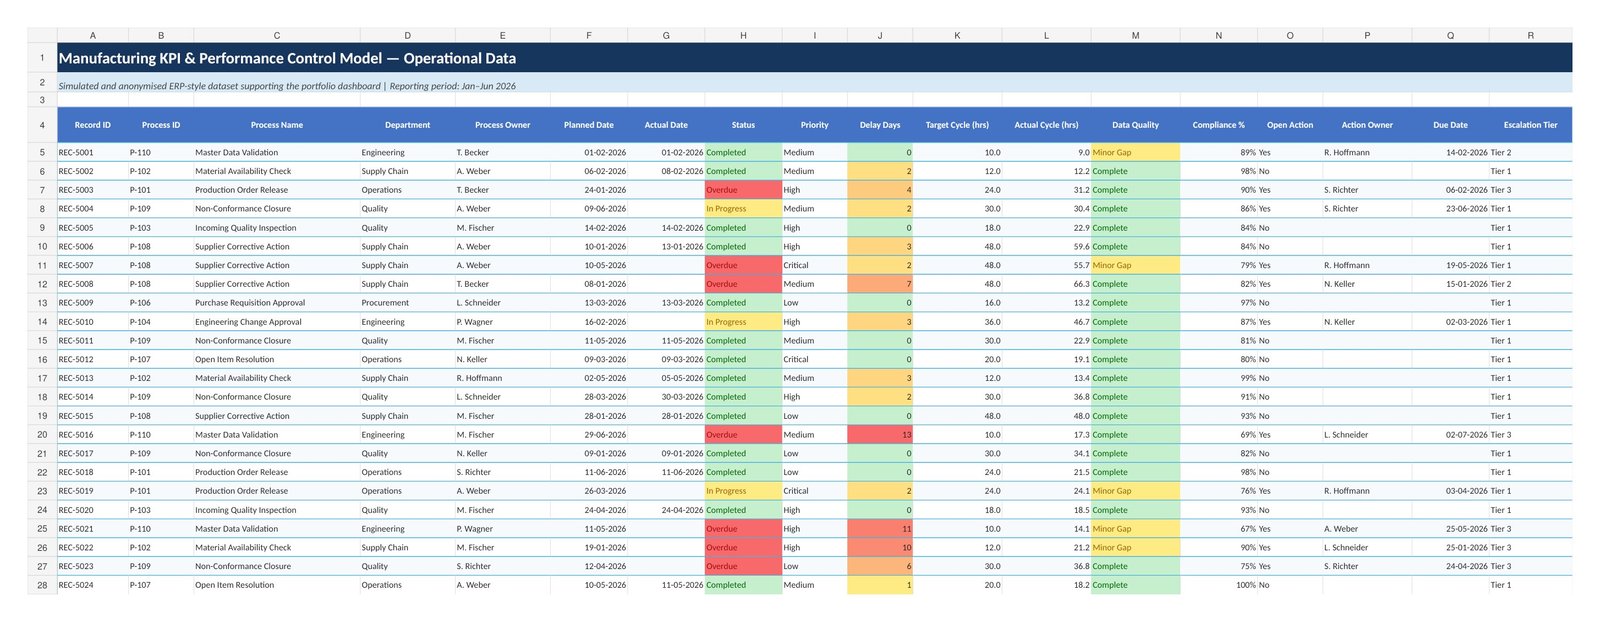
Simulated ERP-style operational data register - the record-level source behind every KPI in the catalogue.
| Data contract | Control purpose |
|---|
| Planned vs actual date | Delay and on-time completion |
| Target vs actual cycle | Capability and process stability |
| Data-quality status | Signal confidence |
| Action owner and due date | Closed-loop accountability |
| Escalation tier | Management response level |
Management by Exception
Not every miss deserves the same meeting, owner, or response time. A composite Exception Priority Score (0–100) prioritises attention: 30% deviation magnitude + 25% business impact + 20% recurrence + 15% data confidence + 10% strategic exposure.
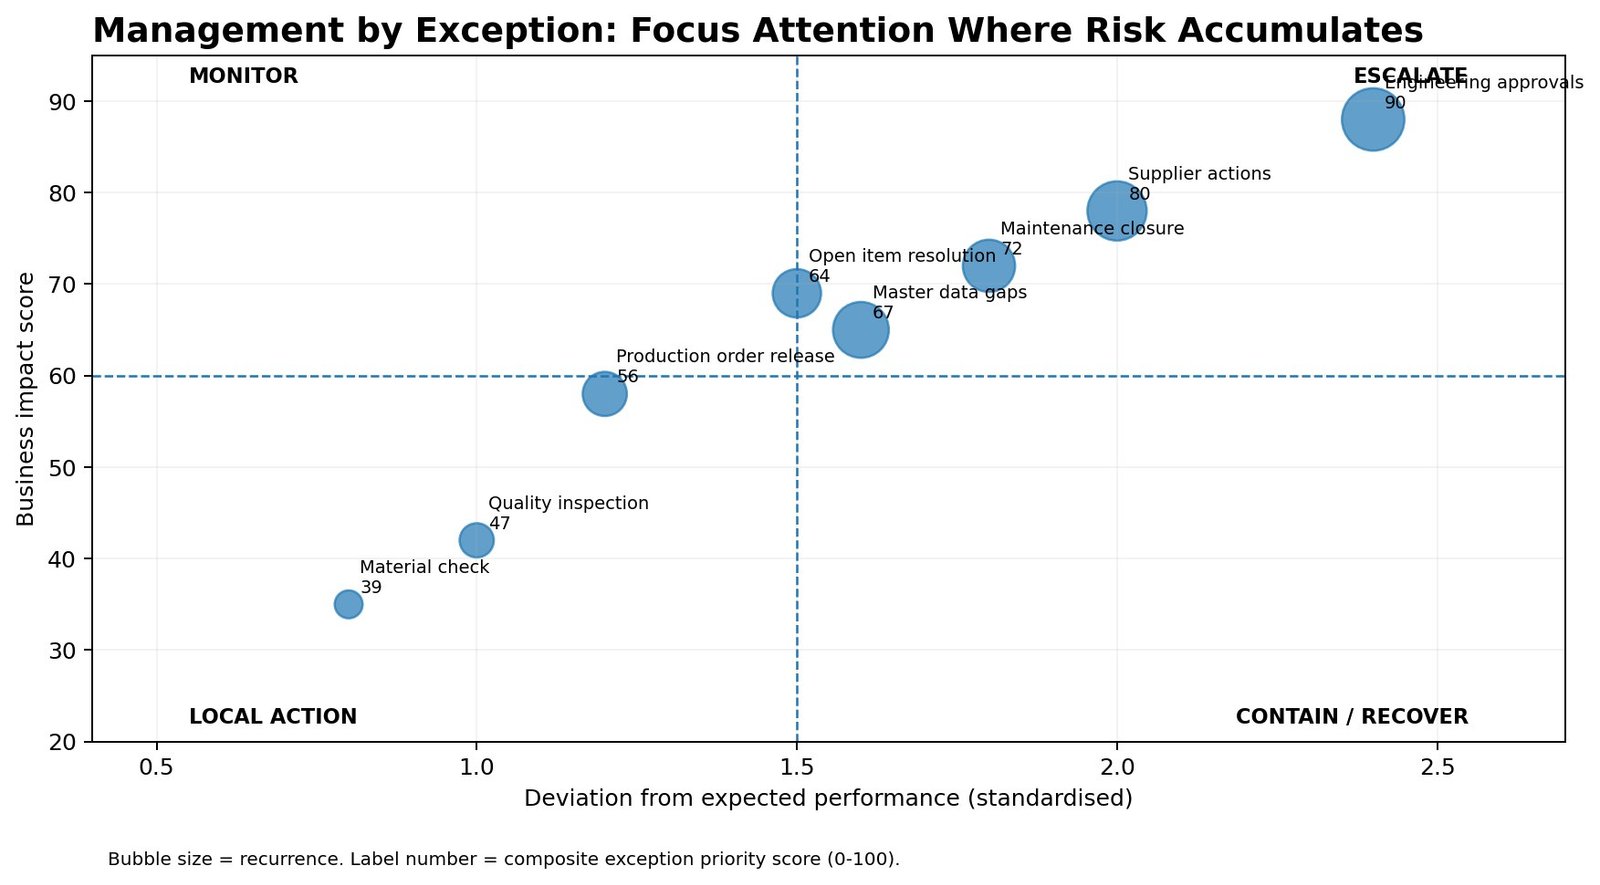
Simulated exception matrix. Bubble size = recurrence; label = composite exception priority score (0–100).
| Score | Control level | Expected action |
|---|
| 75–100 | Escalate | Cross-functional owner, containment, daily review |
| 50–74 | Functional action | Named owner, due date, weekly verification |
| Below 50 | Local control | Resolve within the standard process |
Governance & Control Rhythm
The final deliverable is a control constitution: definitions, thresholds, owners, cadence, and escalation rules.
Daily - review special-cause signals and critical exceptions
Weekly - review ageing actions, causal leading indicators, and owner commitments
Monthly - reassess process capability, KPI definitions, and whether the control rules still reflect the operating reality
91.7→96.1%
On-time completion · modelled scenario
18→9
Overdue actions · modelled scenario
94.2→98.0%
Data quality · modelled scenario
8.4→3.1%
Cycle variance · modelled scenario
What this project demonstrates: connecting ERP data, process modelling, statistical control, KPI governance, and management action into one operating model. The project is not presented as a measured company transformation - the figures above are a transparent simulation showing how the control design could influence performance.
Tools
IFS ERP2c8ExcelPower BI conceptsProcess mappingSIPOCKPI treesRACISPCProcess Capability (Cpk/CPU)
Assumptions & Claim Boundaries
Built from real industrial operations exposure at Kraftblock and MBA internship work. Confidential Kraftblock data, customer names, supplier information and internal screenshots are not published without approval. Any numerical business improvement claim is used only where explicitly supported by the final internship thesis or company-approved evidence.
The statistical process-control charts, capability analysis, exception matrix and KPI dashboard mock-ups shown above use an anonymised, simulated dataset built for this portfolio - they are not measured results from a live Kraftblock system.
Benefits & Real-World Carry-Forward
What the project delivers
- Internship thesis/report describing the process-based KPI framework
- Process maps showing activities, decisions, systems and ownership
- KPI catalogue with definitions, formulas, sources, owners, frequencies
- IFS ERP data-source and reporting map, plus RACI matrix
How it applies in real environments
- Traceable link between process design, ERP data and management action
- Reusable method independent of one dashboard technology
- Improved reporting consistency and data-quality discipline
- Faster onboarding to "what does this number mean and who owns it"
Designed a manufacturing control model that converts ERP transactions into statistically governed KPIs, identifies special-cause variation, scores operational exceptions, and links each signal to a named corrective action and verification cycle.
Case Study 04 / 12
NPI & Supply Chain · Self-Directed Case Study · 2025
Independent case study - not an official Tesla project
Tesla 4680 Battery Ramp-Up & Supplier Readiness Strategy
Built a structured launch-readiness model connecting product, process, supplier, material, equipment, workforce and quality gates for a 4680 battery production ramp.
Strategic Problem
A battery programme can appear ready at component level while remaining unstable as a complete production system. Ramp-up requires simultaneous maturity across equipment, material, supplier capacity, process capability, quality controls, workforce readiness and issue governance - so the project treats launch readiness as an integrated system rather than a single milestone.
Eight-Stage Ramp Model
1
Product readiness
Are requirements, interfaces and critical characteristics stable?
2
Process readiness
Can the process repeatedly meet takt and quality requirements?
3
Supplier readiness
Can suppliers deliver qualified material at the required rate?
4
Material readiness
Is material available, visible and sequenced?
5
Equipment readiness
Is equipment installed, validated, maintainable?
6
Pilot build validation
Do pilot builds reveal stable interfaces and manageable defects?
7
Yield stabilisation
Is yield improving and are major losses understood?
8
Volume ramp & CI
Can output increase without losing safety, quality or control?
Supplier Readiness Scorecard (RAG)
Six dimensions are scored Green / Amber / Red: capacity (rate vs. requirement), quality (defect trend, process capability), delivery (on-time, lead time, recovery plan), industrialisation (tooling, fixtures, training), change control (open design/process changes) and risk response (containment speed, escalation quality).
Capacity-versus-Demand Logic
An Excel model compares planned demand against demonstrated capacity (not nominal capacity), highlighting coverage gaps, ramp-rate assumptions, downtime sensitivity and supplier dependencies. Scenario analysis tests base, constrained and recovery cases using clearly labelled synthetic scenario data - never confidential production figures.
Core KPIs
| KPI | Purpose |
|---|
| First-pass yield | Output meeting requirements without rework |
| OEE / availability | Equipment loss and productive utilisation |
| Rate attainment | Demonstrated output vs. ramp plan |
| Supplier on-time delivery | Delivery reliability against production need |
| Material coverage | Continuity before shortage |
| Open critical issues | Unresolved launch risks |
Tools
ExcelPower BI conceptsReadiness scorecardsRisk heatmapsCapacity modellingMRP conceptsQuality gates
Assumptions & Claim Boundaries
Developed for Tesla interview preparation and portfolio positioning - not an official Tesla project. No work on Tesla production equipment, proprietary battery chemistry or confidential supplier data is claimed, and no actual Tesla yield or output improvement is implied.
Benefits & Real-World Carry-Forward
What the project delivers
- Eight-stage ramp-up roadmap with readiness-gate logic
- Supplier maturity scorecard and risk heatmap
- Capacity-versus-demand scenario model
- Launch risk register and escalation workflow
How it applies in real environments
- Structured, evidence-based launch decision-making
- Faster identification of the true production constraint
- Escalation path linkable to a broader tier-based operating model
- Reusable readiness-gate logic for any high-volume ramp
Case Study 05 / 12
Professional Project · Reconstructed Analytics Layer · Dec 2021–Aug 2023
Think and Learn CRM & Sales Performance Intelligence System
Used CRM-led sales execution, performance reporting and team leadership to improve funnel visibility, follow-up discipline and commercial performance, including more than INR 1.2 crore revenue in 11 months.
Business Context
A high-volume education-sales environment requires disciplined lead handling. Revenue performance depends on how quickly leads are contacted, how consistently follow-ups are completed, how accurately opportunity stages are maintained, and how clearly managers can see funnel leakage. I worked in a high-volume sales environment where thousands of leads moved through the CRM every month - the real challenge was not simply generating activity, it was deciding which leads deserved attention, how quickly the team should act, where revenue was being lost, and how performance could be made more predictable.
How CRM data can become a complete revenue operating system
How lead prioritisation, follow-up discipline, and coaching affect conversion
How management can move from target tracking to forward-looking revenue control
How individual execution connects to team capacity and business outcomes
Verified Professional Responsibilities
Managed customer leads and sales opportunities through the operational CRM workflow
Used LeadSquared CRM to record activity, update status and manage follow-up discipline
Tracked individual and team performance using CRM reports and Excel
Led a team of approximately 7–10 members and reviewed performance regularly
Verified Commercial Outcomes
₹1.2Cr+
Revenue generated in 11 months
#1
Regional rank across AP & Telangana
~30%
Team output improvement
Also received top-performer recognition, including an NS200 motorcycle award.
Role Progression & Operating Problem
I progressed through three roles - Senior Business Development Associate, Team Lead, and Senior Business Development Specialist - covering direct sales, customer counselling, CRM discipline, team coordination, weekly reporting, performance coaching, and revenue delivery.
Lead volume was high, but lead quality and intent were uneven
Slow first contact reduced the chance of conversion
Follow-up quality varied between representatives
A busy pipeline did not always produce a reliable forecast
Team activity needed to be converted into focused coaching actions
| Operating question | Approach used in the role | Portfolio model created |
|---|
| Which leads need attention first? | Reviewed lead intent, response, ageing, and customer need | Transparent lead-scoring framework |
| Where is revenue being lost? | Tracked stage movement, follow-ups, demos, objections, and payment drop-off | Lead funnel and revenue-leakage model |
| How should leads be allocated? | Balanced priority, representative capacity, and regional fit | Smart allocation decision rules |
| Who needs coaching? | Compared activity, conversion, and revenue contribution | Team performance and coaching matrix |
| What revenue is likely to close? | Reviewed pipeline stage, lead quality, and payment confidence | Base, upside, and downside forecast scenarios |
Strategy Reconstruction
A hand-drawn strategy board connects the funnel, lead scoring, customer response, team coaching, forecasting, and the 90-day operating roadmap into one commercial system.
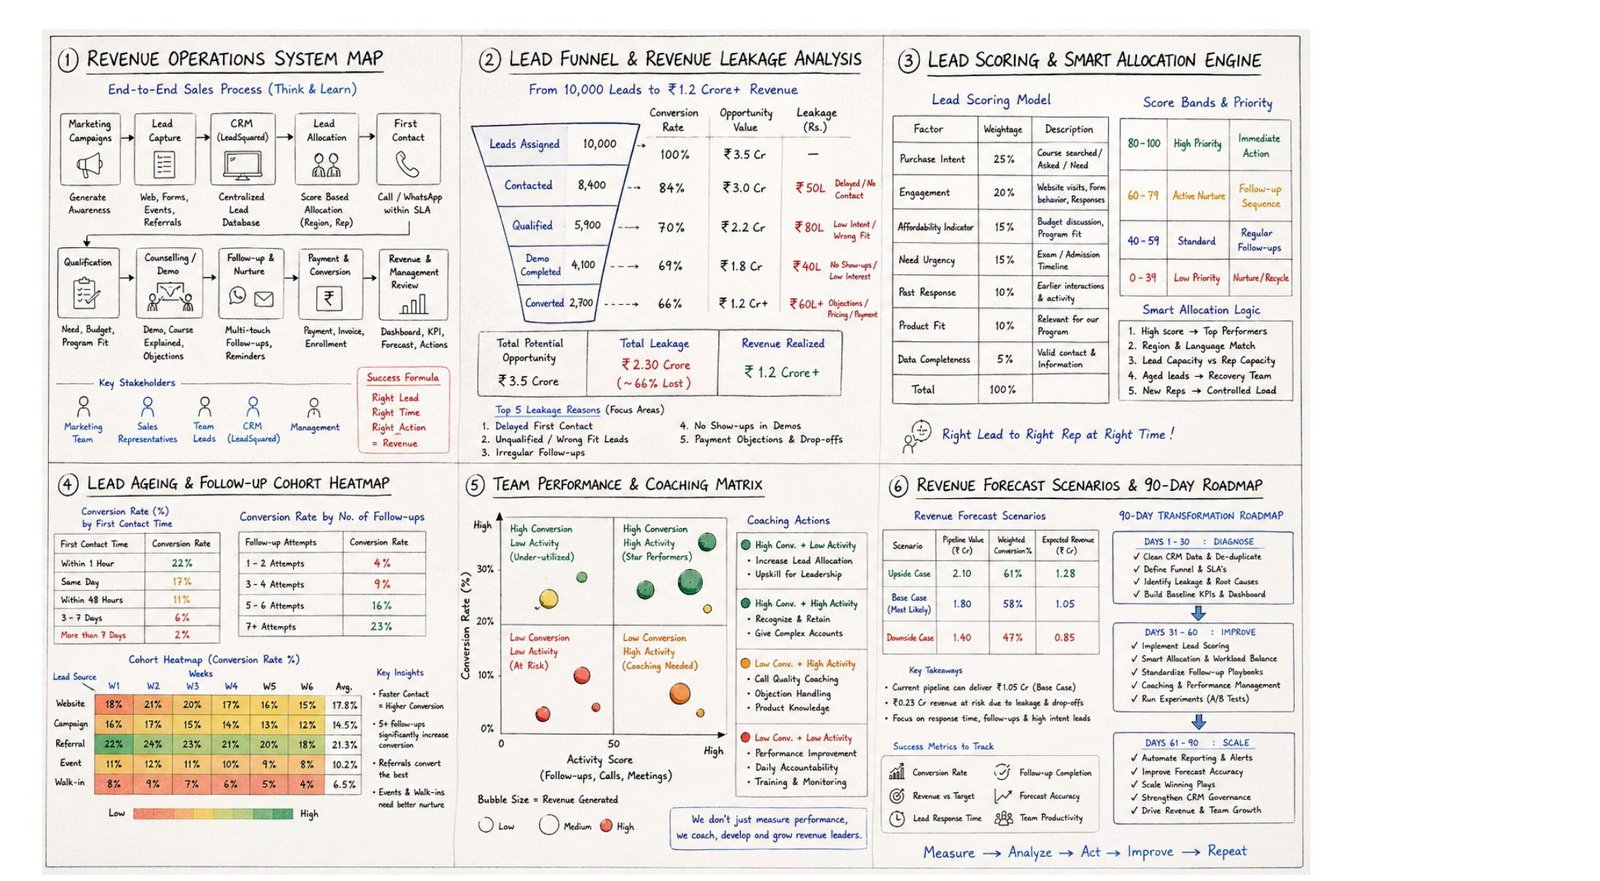
Reconstructed and anonymised for portfolio use - no confidential customer or company data is shown.
Lead Funnel & Revenue Leakage
Where did potential revenue reduce as leads moved from assignment to contact, qualification, counselling, and payment? The reconstructed funnel is built around the documented INR 1.2 crore-plus result.
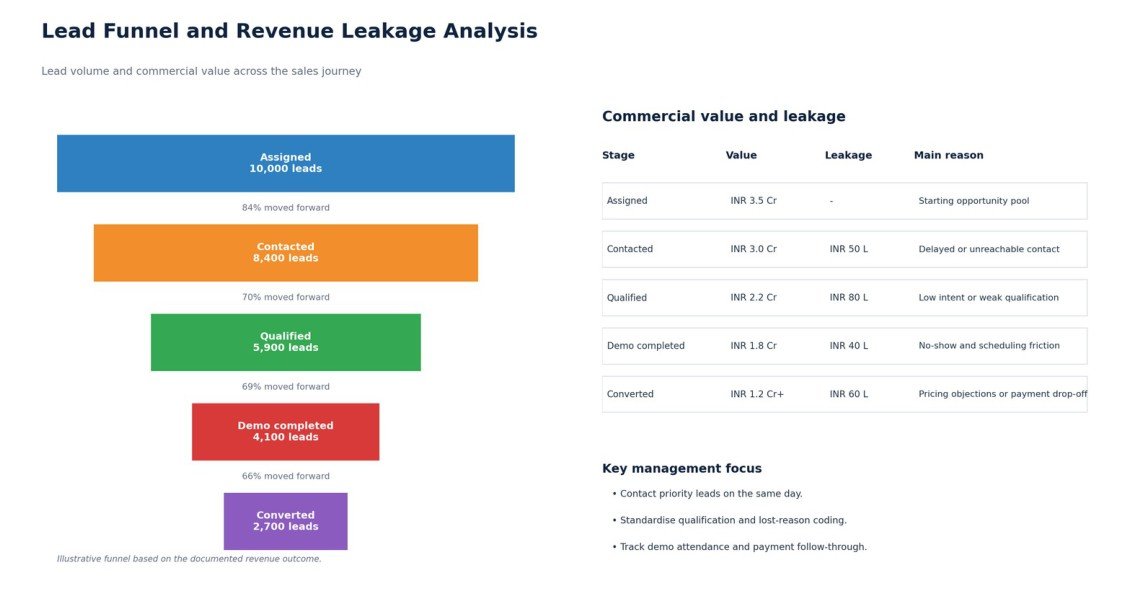
Illustrative funnel based on the documented revenue outcome.
Main insight: response speed, qualification quality, demo attendance, and payment follow-through are the biggest controllable revenue levers.
Contact priority leads on the same day
Standardise qualification and lost-reason coding
Track demo attendance and payment follow-through
Canonical Sales Funnel
| Stage | Key control |
|---|
| Lead received | Allocation, source, response ownership |
| Contacted | Attempt quality and contact status |
| Qualified | Need, affordability, timing and fit |
| Counselling/demo | Value communication and next step |
| Follow-up | Scheduled action, ageing, objection status |
| Negotiation | Decision readiness |
| Converted | Payment/closure and revenue recognition |
| Lost/closed | Reason capture and learning |
Lead Scoring & Smart Allocation
Not every lead deserves the same urgency, and not every representative should receive the same type of lead - the model makes prioritisation transparent and easier to manage.
| Factor | Weight | Description |
|---|
| Purchase intent | 25% | Course searched / asked / need |
| Engagement | 20% | Website visits, form behaviour, responses |
| Affordability indicator | 15% | Budget discussion, program fit |
| Need urgency | 15% | Exam / admission timeline |
| Past response | 10% | Earlier interactions & activity |
| Product fit | 10% | Relevant for our program |
| Data completeness | 5% | Valid contact & information |
| Score band | Priority | Action |
|---|
| 80–100 | High priority | Immediate action |
| 60–79 | Active nurture | Follow-up sequence |
| 40–59 | Standard | Regular follow-ups |
| 0–39 | Low priority | Nurture / recycle |
Core allocation rules:
High-value, high-intent leads go to experienced closers
Regional and language fit improves customer comfort
Overloaded representatives receive fewer fresh leads
Aged leads move into a recovery workflow
New team members receive controlled lead volume
Response Speed & Follow-up Cohort
How does conversion change when first contact is delayed, and how much can additional follow-up recover?
Fast first contact improves the chance of a meaningful conversation
A structured sequence is stronger than irregular follow-up
Very old leads need a separate recovery strategy
Response time should be treated as a core commercial KPI
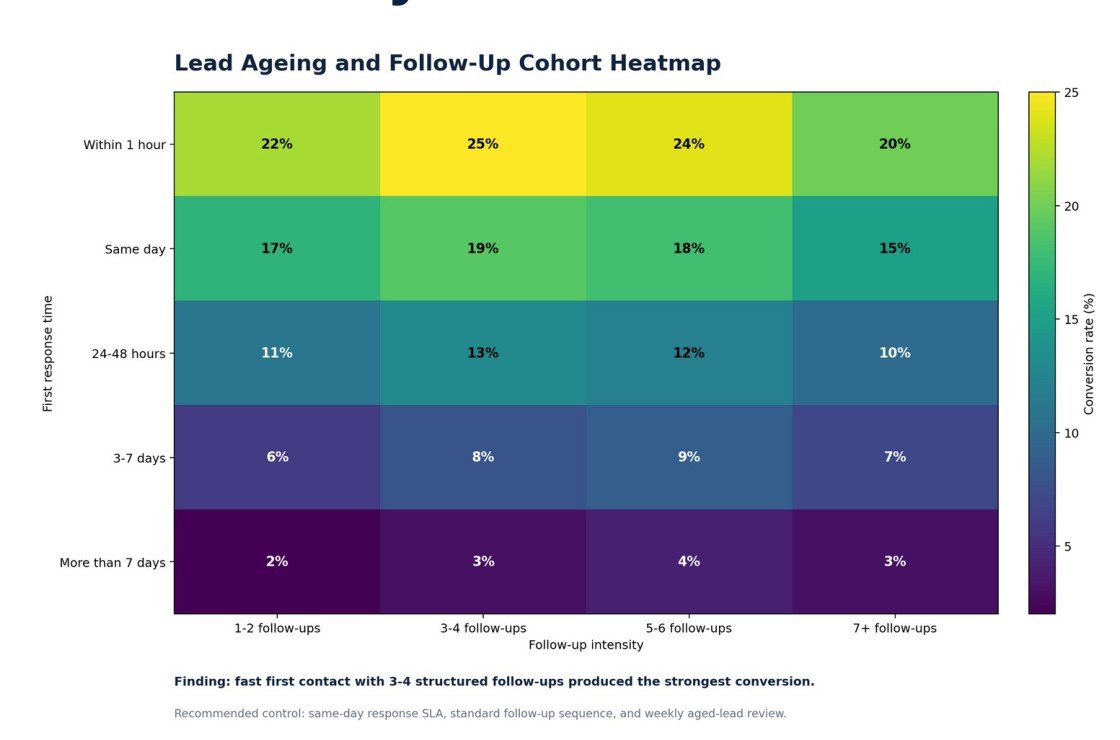
Finding: fast first contact with 3–4 structured follow-ups produced the strongest conversion.
Recommended control: same-day first-contact SLA, a standard four-step follow-up sequence, and a weekly aged-lead review.
Team Performance & Coaching
Activity and effectiveness were reviewed separately - this made coaching more specific and helped identify who needed more leads, who needed skill support, and who needed a recovery plan.
High activity + high conversion: retain and scale
High activity + low conversion: coach objection handling
Low activity + high conversion: increase allocation
Low activity + low conversion: time-bound recovery plan
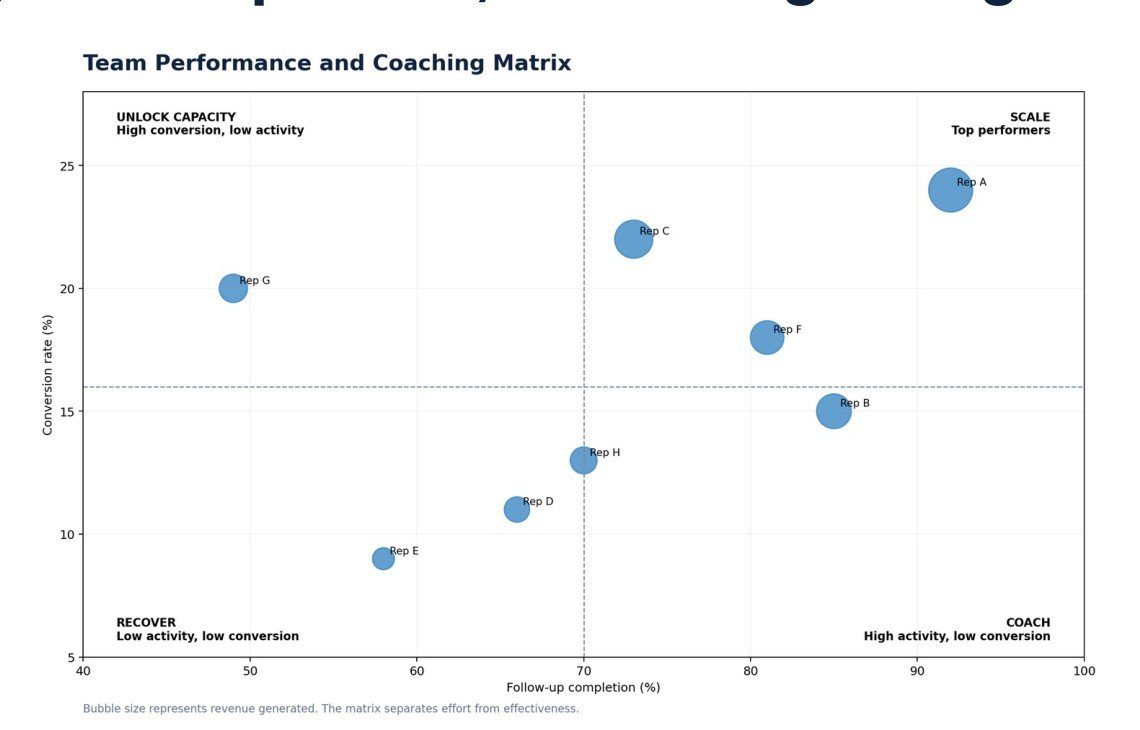
Bubble size represents revenue generated. The matrix separates effort from effectiveness.
Observed result: approximately 30% improvement in team output, supported by focused tracking and coaching. The coaching conversation becomes practical: what behaviour must change, what support is required, and how will progress be measured?
Forecasting & 90-Day Roadmap
| Scenario | Pipeline value | Weighted conversion | Expected revenue |
|---|
| Upside case | ₹2.10 Cr | 61% | ₹1.28 Cr |
| Base case (most likely) | ₹1.80 Cr | 58% | ₹1.05 Cr |
| Downside case | ₹1.40 Cr | 47% | ₹0.85 Cr |
Management rhythm:
Daily huddle - priority leads, overdue follow-ups, demos, and blockers
Weekly pipeline review - stage movement, ageing, conversion, coaching, and redistribution
Monthly business review - revenue vs target, forecast accuracy, segments, tests, and capacity
Days 1–30
Diagnose
Clean CRM data & de-duplicate; define funnel & SLAs; identify leakage & root causes; build baseline KPIs & dashboard
Days 31–60
Improve
Implement lead scoring; smart allocation & workload balance; standardise follow-up playbooks; coaching & performance management; run A/B tests
Days 61–90
Scale
Automate reporting & alerts; improve forecast accuracy; scale winning plays; strengthen CRM governance; drive revenue & team growth
Success metrics tracked: conversion rate, follow-up completion, revenue vs target, forecast accuracy, lead response time, team productivity.
Tools
LeadSquared CRMExcelReporting dashboardsPower BI (reconstruction)SQL (reconstruction)Lead scoringRevenue forecastingCoaching frameworks
Assumptions & Claim Boundaries
The revenue, ranking, leadership and output figures above are verified professional results. Any Power BI/SQL layer shown publicly is a reconstruction of the operating model using anonymised or synthetic data - it does not imply an employer-wide Power BI implementation, and Salesforce was never implemented at Think and Learn (LeadSquared was the real CRM used). No customer names, phone numbers or confidential company exports are published.
Credibility boundary: this is a Professional Project based on real Think and Learn work experience. The analytical framework - including the strategy board, funnel, scoring, cohort heatmap, coaching matrix and forecast visuals - is a portfolio reconstruction and should not be described as an official companywide transformation programme unless separately verified.
Benefits & Real-World Carry-Forward
What the project demonstrates
- End-to-end CRM and funnel understanding
- Lead prioritisation and workload design
- Commercial research and scenario thinking
- Targeted team coaching and performance management
- Forecasting and operating-governance design
How it applies in real environments
- Demonstrates CRM discipline translating directly into revenue
- Reusable funnel-and-ageing model for any lead-driven sales team
- Combines hands-on leadership with data-led coaching
Converted a high-volume CRM sales operation into a complete revenue-operating system - lead scoring, funnel-leakage analysis, response-time research, coaching-driven team management, and scenario-based forecasting - built around a verified ₹1.2 crore-plus result and a #1 regional ranking across Andhra Pradesh & Telangana.
Case Study 06 / 12
Route Network Planning · Independent Academic Project · 2026
Independent academic project - not an official Flix publication
Flix Network Planning & Route Performance Analysis
Turning route data into clear network decisions - a repeatable method for deciding where an intercity coach network should expand, optimise, maintain or review service.
Key Outcomes
80
Route-week observations analysed
20
Corridors compared using consistent measures
5
Weighted criteria in the prioritisation model
1
Route hypothesis tested through a measurable pilot
Case Objective
Passenger volume alone does not show whether a route is healthy. A busy route may have weak margins, while a profitable route may suffer from poor punctuality or an inefficient timetable. The study combines commercial and operational measures in one decision model - the strength of the project is not a single formula, it is the complete workflow from raw data to decision-ready output.
Research questions:
Which corridors show enough demand and margin to test more frequency?
How do departure times affect load factor and vehicle utilisation?
Which routes are commercially attractive but operationally weak?
What measurable gate should be used before permanent expansion?
How should each route be classified: expand, optimise, maintain or review?
Research Design
1
Prepare
Validated route fields and standardised the dataset
2
Calculate
Measured utilisation, revenue, cost, contribution and reliability
3
Diagnose
Compared routes and identified reasons behind weak performance
4
Score
Applied a transparent weighted model across common criteria
5
Test
Built timetable scenarios and pilot gates before final recommendations
Analytical Workflow
1. Understand the dataset structure and define the unit of analysis
2. Check missing values, duplicates, inconsistent formats
3. Standardise fields and create helper columns
4. Use lookup logic to connect related tables
5. Build route-level KPIs and compare performance patterns
6. Use pivots, filters and charts to isolate differences
7. Convert observations into practical recommendations
8. Create a concise management summary
Methodology - Four Analytical Dimensions
The analysis moved from raw data to a route decision across demand, economics, service quality and strategic fit.
| Dimension | What it covers |
|---|
| Demand | Load factor, passenger volume and direction of demand |
| Economics | Fare, revenue, operating cost and contribution |
| Service quality | On-time performance, cancellations and schedule quality |
| Strategic fit | Hub value, connections and corridor importance |
Core calculations
| Measure | Logic | Why it matters |
|---|
| Load factor | Average passengers / seats per trip | Shows how efficiently available capacity is used |
| Weekly contribution | Revenue − variable cost − fixed cost | Tests whether the route creates value after operating costs |
| Contribution margin | Contribution / revenue | Makes routes of different sizes comparable |
| Break-even load factor | Required passengers to cover route cost / available seats | Shows the minimum demand needed to avoid a loss |
| Prioritisation score | 30% demand + 25% margin + 20% reliability + 15% strategic fit + 10% complexity | Creates one transparent and repeatable route score |
Decision rule - commercial attractiveness: demand strength, contribution margin, revenue potential and strategic corridor value. A high score indicates a stronger commercial case.
Operational feasibility:
Timetable and vehicle feasibility
On-time performance and cancellation exposure
Execution complexity and data quality
Ability to validate the change through a controlled pilot
Network View
Line width represents passenger volume; line style represents the recommended network action across 10 European corridors.
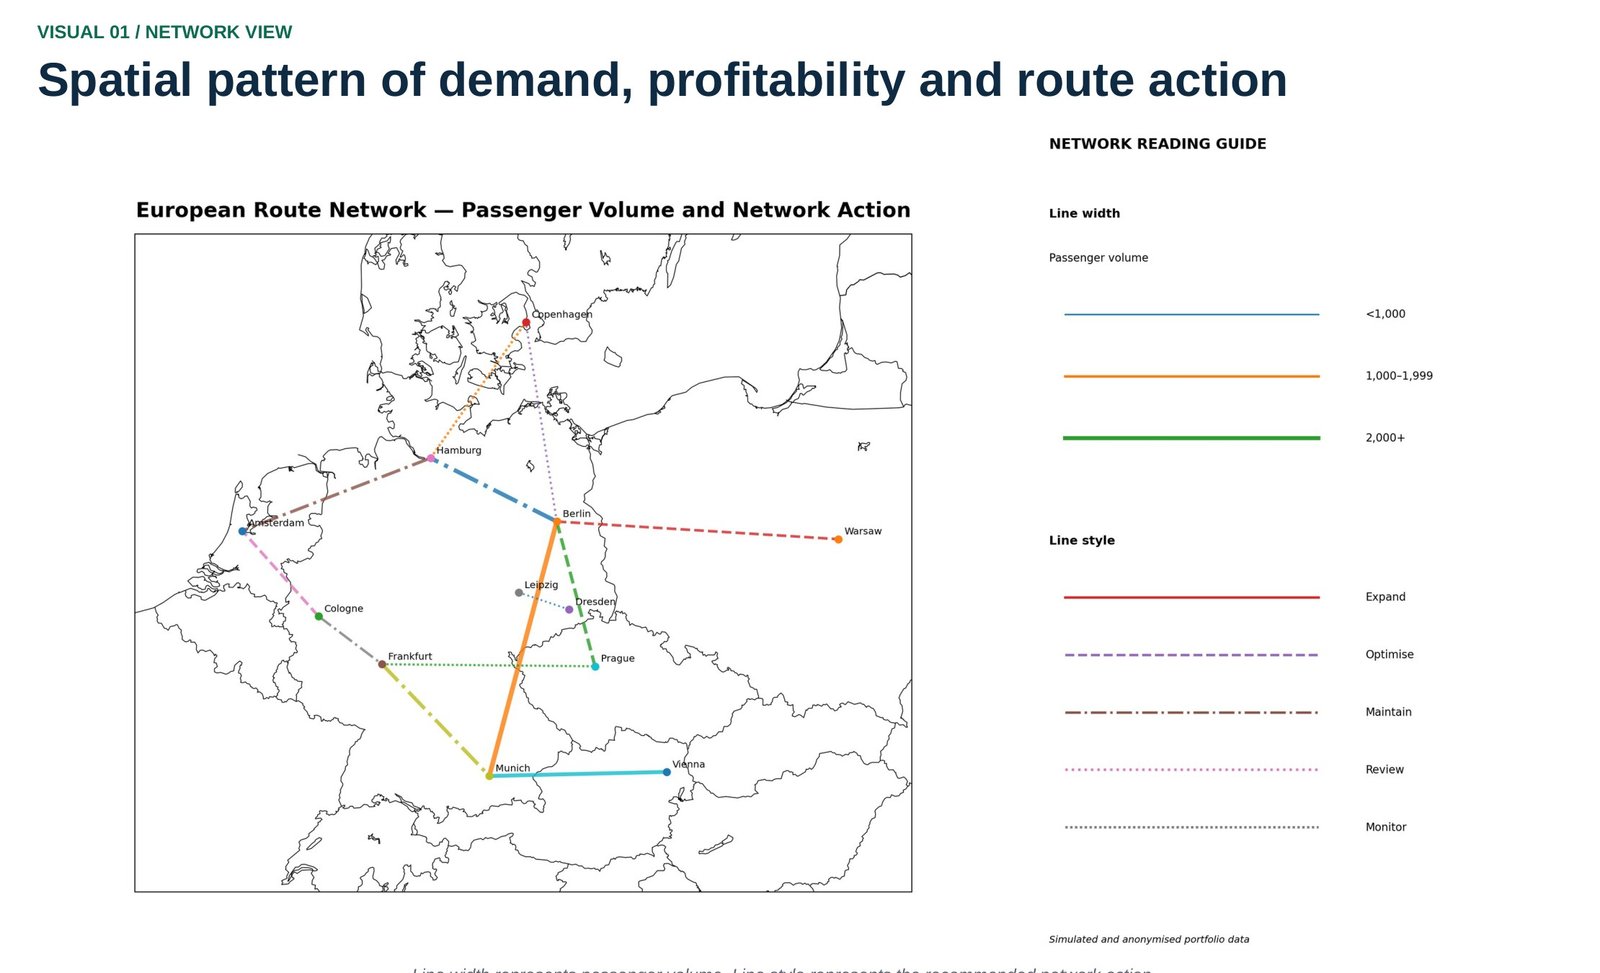
Simulated and anonymised portfolio data.
Finding 1 - expansion: Berlin–Munich and Munich–Vienna combine strong volume, margin and network value
Finding 2 - optimisation: Berlin–Prague and Berlin–Warsaw show potential, but schedule or reliability limits immediate expansion
Finding 3 - review: Berlin–Copenhagen and Leipzig–Dresden require a stronger economic or operational case before more capacity is added
Schedule Design
The revised timetable removes weak late-night departures and shifts capacity toward stronger morning, afternoon and weekend demand windows - testing whether better timing can improve utilisation before the network adds more total trips.
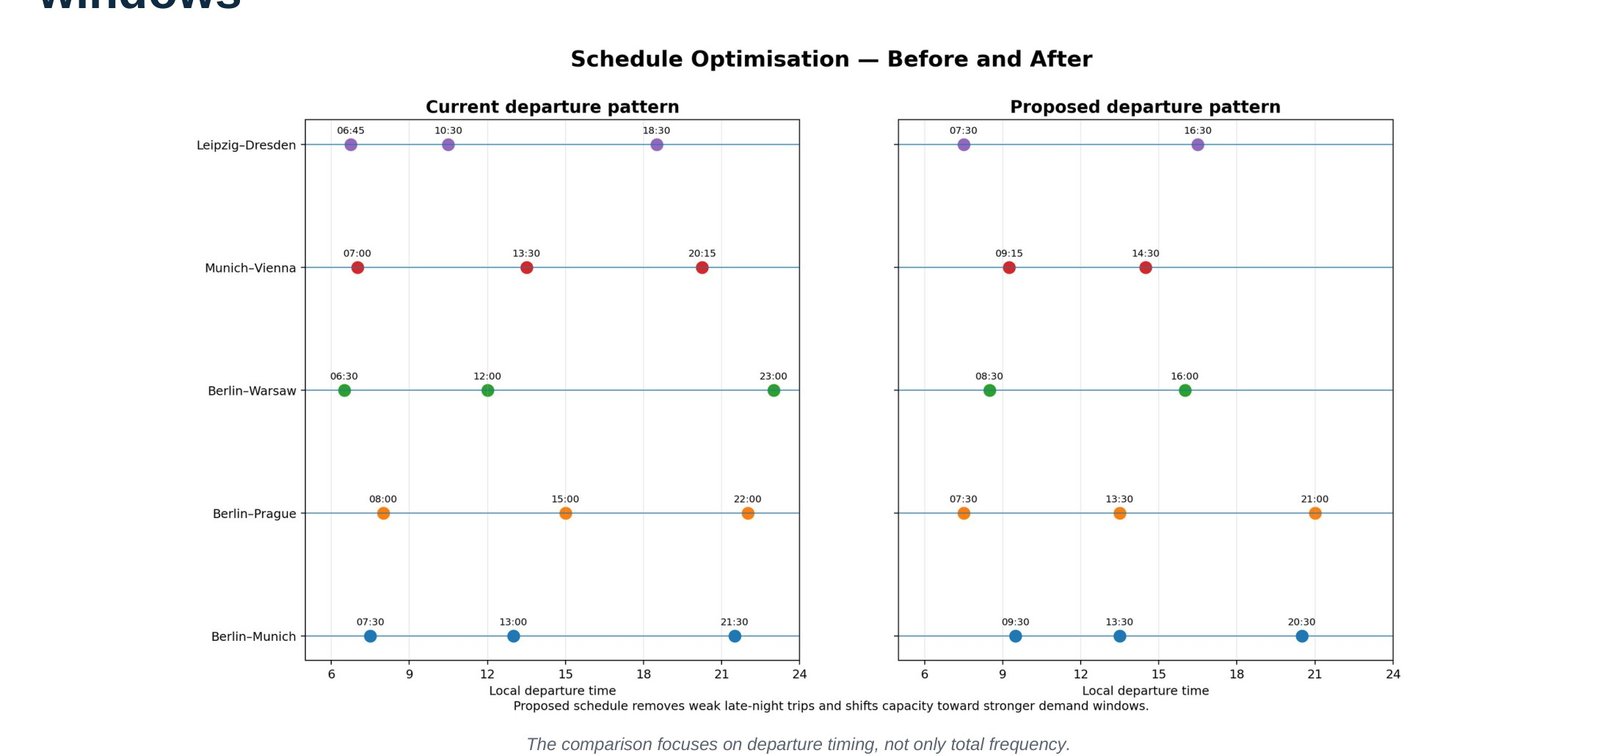
Proposed schedule removes weak late-night trips and shifts capacity toward stronger demand windows.
Higher load factor on retained departures
Improved vehicle utilisation across the day
Lower share of weak departures
Better connection windows between major cities
Route Economics - Berlin–Munich
The corridor combines high demand, strong weekly contribution, and resilient utilisation. The proposal adds two peak departures during Friday and Sunday demand windows.
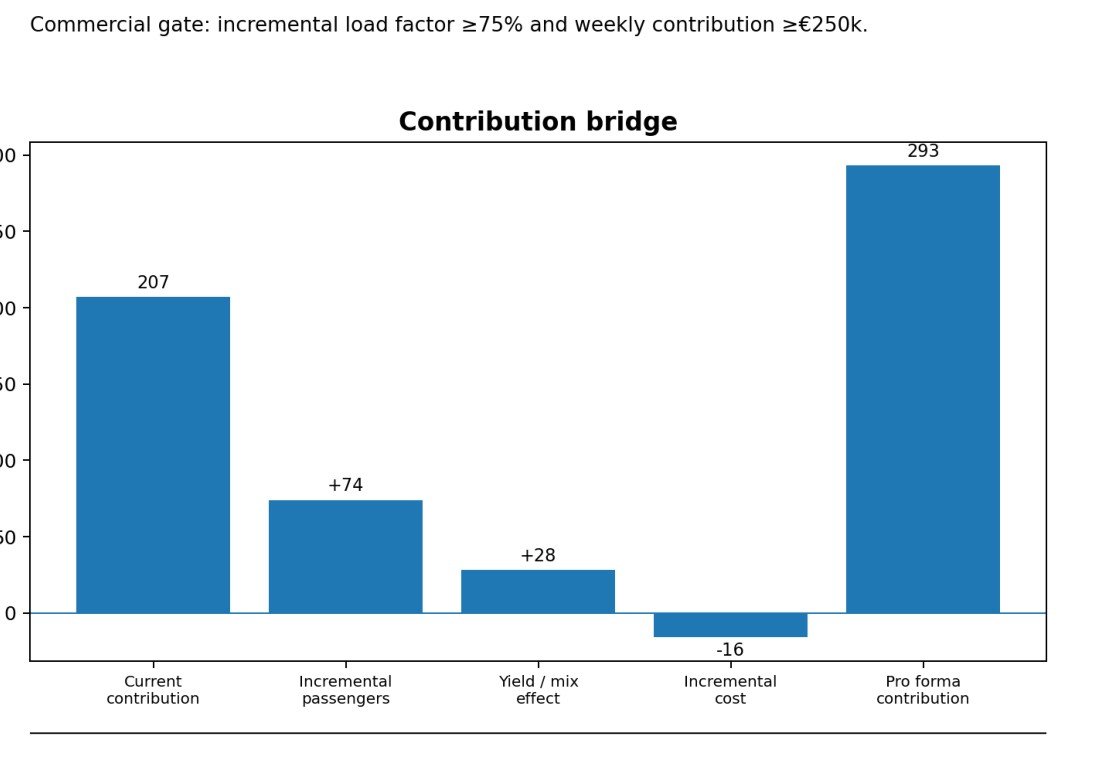
Simulated and anonymised portfolio data. Commercial gate: incremental load factor ≥75% and weekly contribution ≥€250k.
Recommendation: run a four-week pilot with two additional peak departures. Make the change permanent only when incremental load factor stays at or above 75% and weekly contribution reaches at least €250k.
≈ €85k incremental weekly contribution
Fewer >90% load events on peak days
Stronger connections into Hamburg and Cologne
Key risks: vehicle/crew availability, competitive discounting, congestion during peak windows
Route Portfolio Decision
Bubble size represents weekly revenue; the axes separate commercial value from execution feasibility across the corridor portfolio.
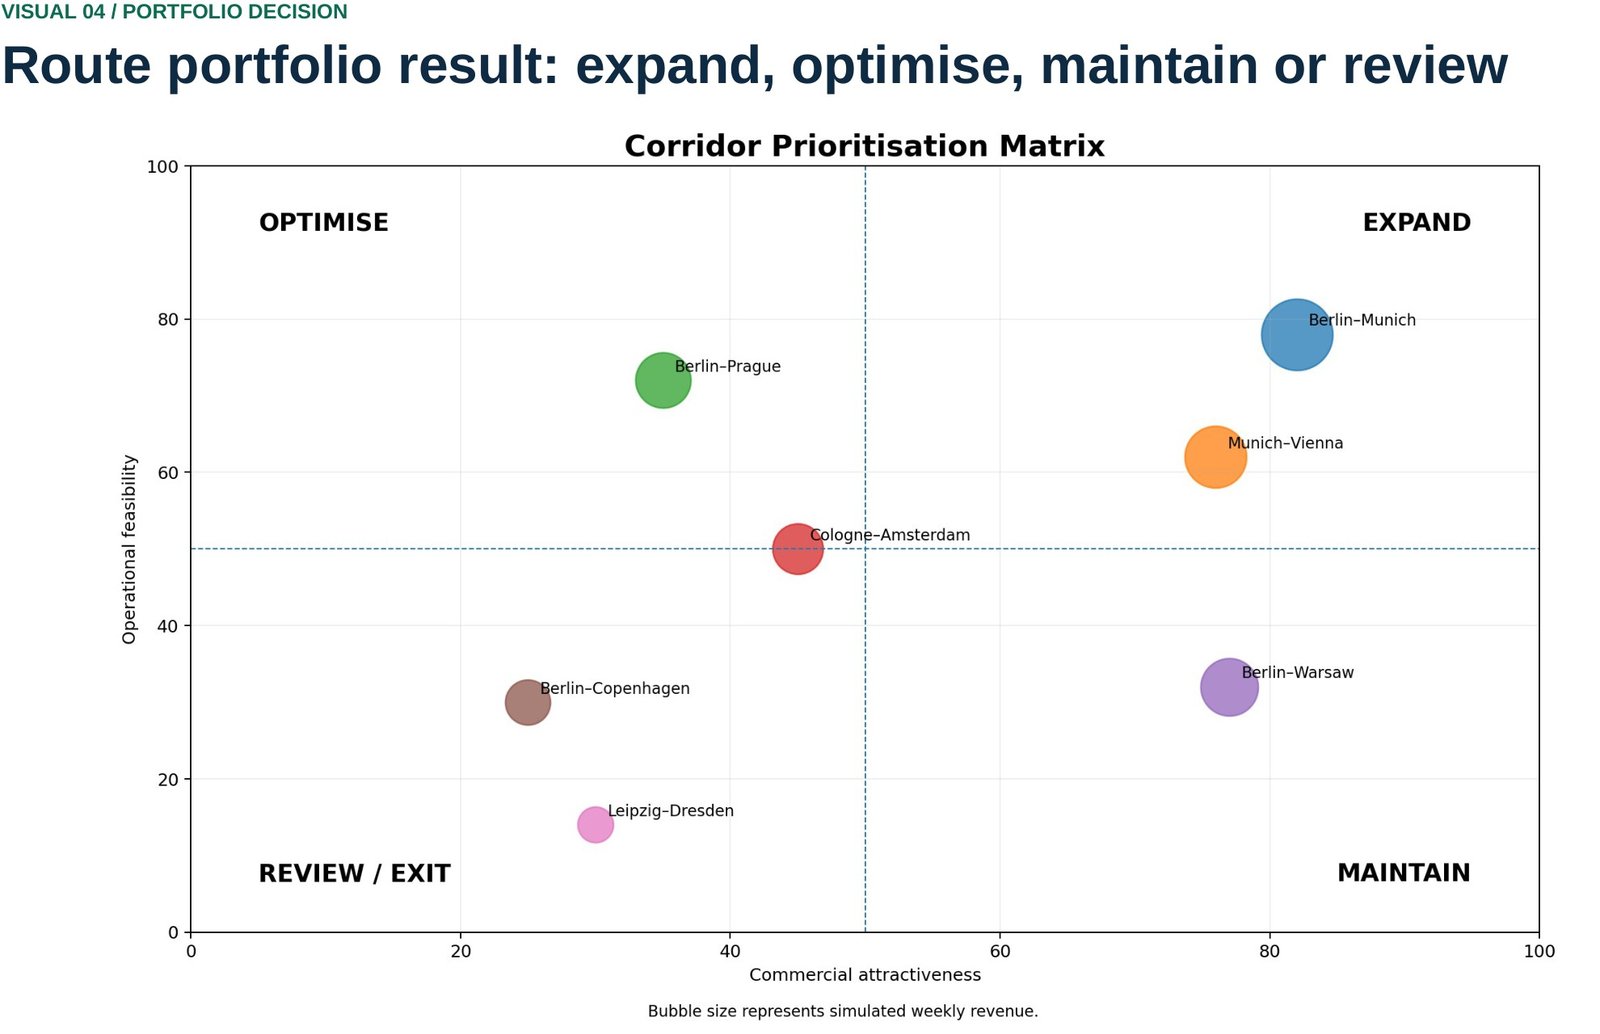
Bubble size represents simulated weekly revenue. The axes separate commercial value from execution feasibility.
Expand - Berlin–Munich, Munich–Vienna: test more capacity
Optimise - Berlin–Prague, Cologne–Amsterdam: improve schedule, pricing or connections
Maintain - Berlin–Warsaw: protect demand while fixing constraints
Review - Berlin–Copenhagen, Leipzig–Dresden: redesign, reduce or exit
Excel Methods Demonstrated
| Method | Application in the case |
|---|
| Data validation | Checked completeness, duplicates, inconsistent formats |
| XLOOKUP / lookup logic | Connected route or reference fields across tables |
| Pivot tables | Summarised data by route, category, period |
| Conditional formatting | Highlighted exceptions and data-quality risks |
| Calculated fields | Route-level KPIs and comparison measures |
| Charts | Made patterns visible for a non-technical reviewer |
Tools
ExcelData cleaningPivot tablesXLOOKUPConditional formattingChartsCost modellingWeighted scoringRoute economicsTimetable design
Academic Integrity & Limitations
This is an independent academic project, not an official Flix publication. The dataset is simulated and anonymised so the methodology, calculations and decision logic can be shown without presenting confidential company information. Results are directional because the model does not include competitor reactions, full driver scheduling, station constraints or real booking-curve data. The project demonstrates the research method and decision logic.
Benefits & Real-World Carry-Forward
Research strengths
- Transparent data preparation and calculation logic
- Route economics and break-even analysis
- Timetable scenario design
- Weighted multi-criteria prioritisation
- Measurable pilot gates and stated limitations
How it applies in real environments
- Comfort working with ambiguous business data under a deadline
- Ability to audit data before drawing conclusions
- Judgement to separate a finding, an assumption and a recommendation
In this independent academic project, I analysed passenger demand, capacity utilisation, route economics, service reliability and timetable quality across European coach corridors. I used a weighted decision model to classify routes into expansion, optimisation, maintenance or review. The final output includes a network map, a timetable scenario, a Berlin-Munich route hypothesis and a corridor prioritisation matrix.
Case Study 08 / 12
Product Strategy · Self-Directed Case Study · 2025
Independent case study - no official BMW affiliation
BMW Digital Garage: Predictive After-Sales Platform
Designed a digital after-sales ecosystem that converts vehicle-health signals into predictive service actions, transparent workshop coordination and personalised ownership support.
Customer Problem
Vehicle service is often reactive. Drivers may not understand warning signals, service prices, workshop timing or whether a recommended intervention is urgent. The concept reduces uncertainty by connecting vehicle status, service history, maintenance prediction, workshop availability and customer communication in one digital journey.
Primary Personas
New EV owner - needs confidence about battery, software and charging-related service
Busy professional - needs fast, low-effort service coordination
Long-distance driver - needs reliability before major travel
Fleet / SME operator - needs visibility of downtime, cost and readiness
Feature Capability Map
| Capability | Core feature |
|---|
| Vehicle health | Health summary, warning interpretation, predictive alerts |
| Service planning | Workshop recommendation, slot booking, estimated duration |
| Commercial transparency | Scope explanation, indicative cost, approval flow |
| Execution visibility | Service status, communication, digital handover |
| Ownership record | Digital service history and maintenance timeline |
| Retention | Extension-pack recommendations, service reminders |
MVP & Roadmap
MVP
Trust & coordination
Health overview, alerts, booking, status tracking, service history
Phase 2
Prediction & personalisation
Predictive maintenance, cost guidance, package recommendations
Phase 3
Ecosystem & ops
Fleet tools, workshop capacity, partner integration, analytics
Tools
PersonasCustomer journeyPRDService blueprintPrioritisationRoadmapWireframes
Assumptions & Claim Boundaries
Independently designed - BMW did not sponsor, review or implement this concept, and no BMW vehicle data, diagnostics or internal systems were accessed. Proposed metrics are hypotheses, not achieved product results.
Benefits & Real-World Carry-Forward
What the project delivers
- Product vision, personas, customer journey and service blueprint
- PRD with functional/non-functional requirements
- Phased roadmap and KPI/business-value hypothesis
How it applies in real environments
- Demonstrates product discovery and service-design thinking
- Reusable pattern for any predictive-maintenance product
- Bridges customer experience with workshop operations
Case Study 10 / 12
Academic Research Project · 2026
Research in progress - findings pending validation
EV After-Sales Service Extension Pack Research
Investigates which EV after-sales services customers value, how much they may be willing to pay, and how service-pack design could improve trust and retention.
Research Problem
EV ownership introduces after-sales concerns distinct from conventional vehicles - battery confidence, software support, charging-related assistance and long-term maintenance uncertainty. The study explores whether a structured extension pack can reduce this uncertainty and create value for both customers and mobility providers.
Research Questions
Which after-sales benefits matter most to EV owners or prospective buyers?
How does willingness to pay vary by customer profile and package design?
Which factors most strongly influence purchase intention?
Can service packages improve brand trust and perceived ownership security?
Which duration, channel and pricing approach seem most acceptable?
Methodology
1. Review literature and define the conceptual model
2. Translate research questions into measurable survey variables
3. Pilot the questionnaire, remove ambiguous questions
4. Collect at least 30 valid responses for the revised analysis
5. Clean the dataset and code categorical variables
6. Run descriptive statistics and reliability checks
7. Use regression / conjoint-style analysis only where sample and design support it
8. Convert findings into a practical service-pack recommendation
Current status: Earlier feedback indicated insufficient responses and missing variables. Final statistical claims will only be published once the survey is reworked, at least 30 valid responses are collected, and the analysis is rerun correctly.
Tools
Survey designExcelDescriptive analysisSegmentationRegression/conjoint concepts
Assumptions & Claim Boundaries
No unvalidated statistical results from the initial low-response dataset are published, and no regression or conjoint findings are claimed until the method and sample support them. Respondent opinions are not presented as representative of the entire German EV market.
Benefits & Real-World Carry-Forward
What the project will deliver
- Research proposal and conceptual framework
- Validated questionnaire and respondent dataset
- Research report with methodology, findings and limitations
How it applies in real environments
- Demonstrates rigorous, disclosure-honest research practice
- Directly informs service-pack pricing and design decisions
- Transferable survey/segmentation method for other customer research
Case Study 11 / 12
Engineering · Final Year Project · 2020
Brain-Controlled
Home Automation (BCI)
Overview
Controlling appliances with your mind - hands-free, signal-driven automation
This final year project developed a Brain-Computer Interface (BCI) system that enables users to control smart home appliances entirely through brainwave signals - specifically EEG (electroencephalography) data captured via the NeuroSky MindWave headset and processed in real-time using MATLAB.
The motivation was accessibility: designing a control system that requires no physical interaction, enabling hands-free operation for people with limited motor function. The system responds to deliberate eye blink patterns detected in the raw EEG stream, translating them into appliance on/off commands via Bluetooth and Arduino-controlled relay modules.
System Architecture
End-to-end signal pipeline
🧠
EEG Signal
NeuroSky MindWave headset captures raw brainwave data
📊
Signal Processing
MATLAB filters noise, detects eye-blink patterns in real-time
📡
Wireless Transmission
Bluetooth HC-05 module sends commands to Arduino
💡
Appliance Control
Arduino triggers relay modules to switch devices on/off
Technical Implementation
How the system works
The NeuroSky headset transmits raw EEG data over Bluetooth to a laptop running a custom MATLAB signal processing pipeline. The pipeline applies bandpass filtering to isolate relevant frequency bands (delta, theta, alpha) and uses amplitude thresholding to distinguish deliberate eye blinks from background neural noise.
Detected blink patterns (single, double, sustained) are mapped to specific appliance commands - lights, fans, and power sockets - and transmitted via the HC-05 Bluetooth module to an Arduino Uno, which drives 5V relay modules connected to real AC appliances in a mock home setup.
SQL was used to log command history, session timestamps, and device state - enabling basic usage analytics and session review for usability testing during the project evaluation phase.
"Combining signal processing with hardware control and structured data logging gave this project real-world complexity - it wasn't just a prototype, it was a working system that bridged neuroscience, embedded engineering, and software."
Challenges & Solutions
Key engineering problems solved
Signal noise: Raw EEG is extremely noisy. Solved with multi-stage bandpass filtering and adaptive threshold calibration per user session.
Latency: Bluetooth transmission introduced delay. Optimised MATLAB processing loop to achieve sub-200ms end-to-end response time.
False positives: Involuntary blinks triggered false commands. Implemented minimum blink duration threshold and inter-command cooldown period.
Hardware reliability: Arduino relay module chatter on AC loads. Added debounce logic in C++ firmware and snubber circuits on relay outputs.
User calibration: EEG baselines vary significantly between users. Built a 30-second calibration routine to personalise thresholds per session.
Cross-platform comms: MATLAB to Arduino serial protocol design - defined a lightweight binary command frame for reliable message delivery.
Tech Stack
MATLAB
Arduino (C++)
NeuroSky EEG
Bluetooth HC-05
SQL (SQLite)
Signal Processing
Relay Control
Embedded Systems
Case Study 12 / 12
Engineering · Self-Directed · 2026
Portfolio Website:
Design, Build & Deployment
This site itself - a multi-page, framework-free portfolio built with a shared design system, custom cursor and scroll interactions, filterable project index, and serverless form handling.
Overview
A case-study portfolio, built page by page from scratch
This is the site you're reading right now. It's a multi-page personal portfolio built to present detailed case studies - manufacturing operations, product strategy, analytics and engineering work - in a consistent, readable, recruiter-friendly format, without relying on a website builder or a JavaScript framework.
The brief was self-set: every project needed its own full case-study page and a place in a filterable index, the whole thing had to feel like one coherent product rather than a stitched-together set of documents, and it had to load fast and work cleanly on a phone in a train station as well as a laptop at a desk.
Site Architecture
One shared shell, many independent case studies
🏠
Home & About
Hero, experience, core strengths, education & certifications, contact
🗂️
Projects Index
Filterable list (by category) plus full inline case studies on one page
📄
Case-Study Pages
Each project also ships as its own standalone, linkable page
🎨
Shared style.css & site.js
One design system and one behavior layer reused across every page
Technical Implementation
Plain HTML, CSS and JavaScript - no build step
The design system runs on CSS custom properties (color, spacing and type tokens shared across light and dark section variants), a single Inter type family from Google Fonts, and reusable component classes (section-block, index-row, feat-list, outcome-row, tech-badge) so every case study looks native to the site instead of pasted in.
Interaction is handled by one shared vanilla JavaScript file: a custom cursor that follows the pointer with an eased requestAnimationFrame loop, scroll-triggered reveal animations via IntersectionObserver, a scroll-aware navigation bar with active-link tracking, and a mobile hamburger menu - all DOM lookups guarded so the same file runs unmodified on pages that only use a subset of these elements.
The project index uses a lightweight category filter (data attributes + class toggling, no framework), and the CV/contact capture flow is wired to Web3Forms as a serverless form endpoint, so there's no backend to host or maintain.
"The constraint was deliberate: no framework, no bundler, no dependencies to keep patched. Just files that open in a browser and still feel designed."
Challenges & Solutions
Keeping every page consistent without a framework
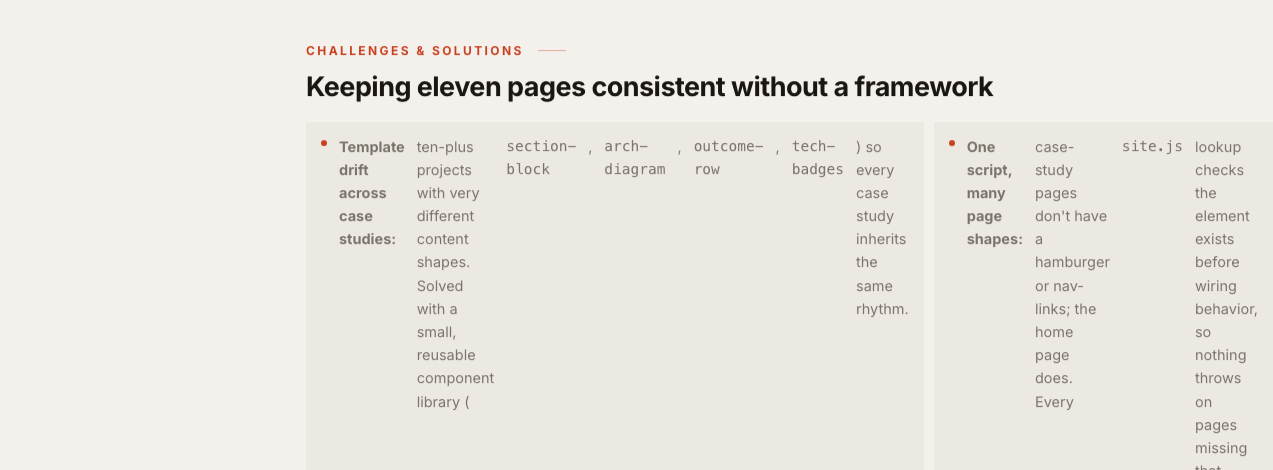
Template drift across case studies: each project has a very different content shape. Solved with a small, reusable component library (section-block, arch-diagram, outcome-row, tech-badges) so every case study inherits the same rhythm.
One script, many page shapes: case-study pages don't have a hamburger or nav-links; the home page does. Every site.js lookup checks the element exists before wiring behavior, so nothing throws on pages missing that markup.
Custom cursor on touch devices: a pointer-follow cursor is meaningless on mobile. Guarded so it only initializes when the cursor elements are present, leaving the native cursor untouched elsewhere.
Duplicated content, single source of truth: each project needs both an index-list summary and a full case study. Kept both in projects.html plus a linkable standalone page, sharing identical copy so nothing drifts out of sync.
Asset-heavy pages without a bundler: 55+ images across dashboards, certificates and screenshots. Organized into one /images directory with consistent naming so pages stay lightweight without image-pipeline tooling.
Form handling with no backend: CV downloads and contact capture needed a submission target. Integrated Web3Forms so the flow works as a static site with zero server code.
Testing & Validation
Confirmed on real widths, not just assumptions
Every page was served from a local static server and driven with headless Chrome rather than checked by reading code alone - full-page screenshots at desktop width against the rest of the site, then a responsive sweep across the site's own breakpoints (≤1024px, ≤960px, ≤540px, ≤480px) from small-phone widths up to a 1440px desktop, with an automated check comparing the document's scroll width to the viewport width to catch horizontal overflow.
Desktop visual regression: full-page screenshots of every new page and section, compared against sibling case studies for spacing, alignment and color.
Responsive sweep: headless Chrome from ~500px up to 1440px, with document.documentElement.scrollWidth checked against viewport width at each size - zero horizontal overflow confirmed.
Real bug caught and fixed: a Challenges list mixing <strong> and <code> tags inside a display:flex row caused each inline tag to become its own flex item, fragmenting the layout. Fixed by wrapping the trailing content in a single <span>, matching the pattern already used elsewhere on the site.
Functional checks: nav-back links, the shared cursor/scroll-reveal behavior from site.js, and the project index's filter bar and inline case sections, verified on both the hub page and this standalone page.
Before - a real bug caught during testing: mixing <strong> and <code> tags inside a flex row fragmented the list instead of flowing as one paragraph.
After - fixed by wrapping the trailing content in a single <span>, collapsing it back into one flex item per row.
Responsive sweep - mobile, tablet and desktop viewports, each with an automated overlay confirming document scroll width matches viewport width (zero horizontal overflow).
Outcomes
4
Responsive breakpoints verified
55+
Image assets organized
Tech Stack
HTML5
CSS3 (Custom Properties)
JavaScript (ES6+)
IntersectionObserver API
Google Fonts (Inter)
Web3Forms
Responsive / Mobile-First Design
Static Site, No Framework
Full Documentation
Go beyond the overview. Explore the complete project documentation, process, and supporting files on GitHub.