Designing a process-based KPI monitoring framework using ERP-style data, KPI definitions, ownership logic, reporting cadence and management control.
A structured six-layer control model that connects operational workflows, ERP data, KPI definitions, ownership, reporting cadence, management review and corrective actions - ensuring accountability, visibility and continuous improvement across the manufacturing value chain.
Period
2026
Context
Kraftblock & MBA internship
Role
Process analyst / KPI designer
Evidence
Strong
Tools
IFS ERP, 2c8, Excel, Power BI concepts
120
Operational records
10
Processes modelled
10
KPI definitions
6-stage
Control loop
Control
Dashboard
KPI
Validation
Data
Process
01 / 10
WHY THIS MATTERS
Why this project matters.
Most operational reports separate process steps, ERP transactions, metric definitions, and action. That separation hides delay, weakens accountability, and makes escalation inconsistent.
COMMON CONTROL GAPS
01
Process and data are separated.
02
KPI definitions differ across teams.
03
Ownership and accountability remain unclear.
04
Ageing and delays remain invisible.
05
Review happens without corrective action.
02 / 10
CONTROL ARCHITECTURE
The six-layer control architecture.
A structured operating model that turns operational activity into managed outcomes.
01
Process layer
Operational workflows and activities that create outcomes.
02
Data layer
ERP transactions and operational records that capture what happened.
03
Validation layer
Checks, thresholds, and rules that ensure data is accurate and reliable.
04
KPI layer
Defined metrics that measure performance against targets.
05
Dashboard layer
Visualisation that turns metrics into decision-ready insight.
06
Control layer
Management review, actions, escalation, and continuous improvement.
03 / 10
MANAGEMENT CONTROL CYCLE
The process-to-KPI control loop.
01
Detect
KPI breaches target or threshold
02
Diagnose
Drill down by process, department and owner
03
Assign
Create corrective action and accountable owner
04
Escalate
Apply Tier 1–3 response based on severity
05
Validate
Confirm effectiveness with updated KPI result
06
Standardise
Update process, ownership or control rule
04 / 10
DATA FOUNDATION
Operational data is the foundation of control.
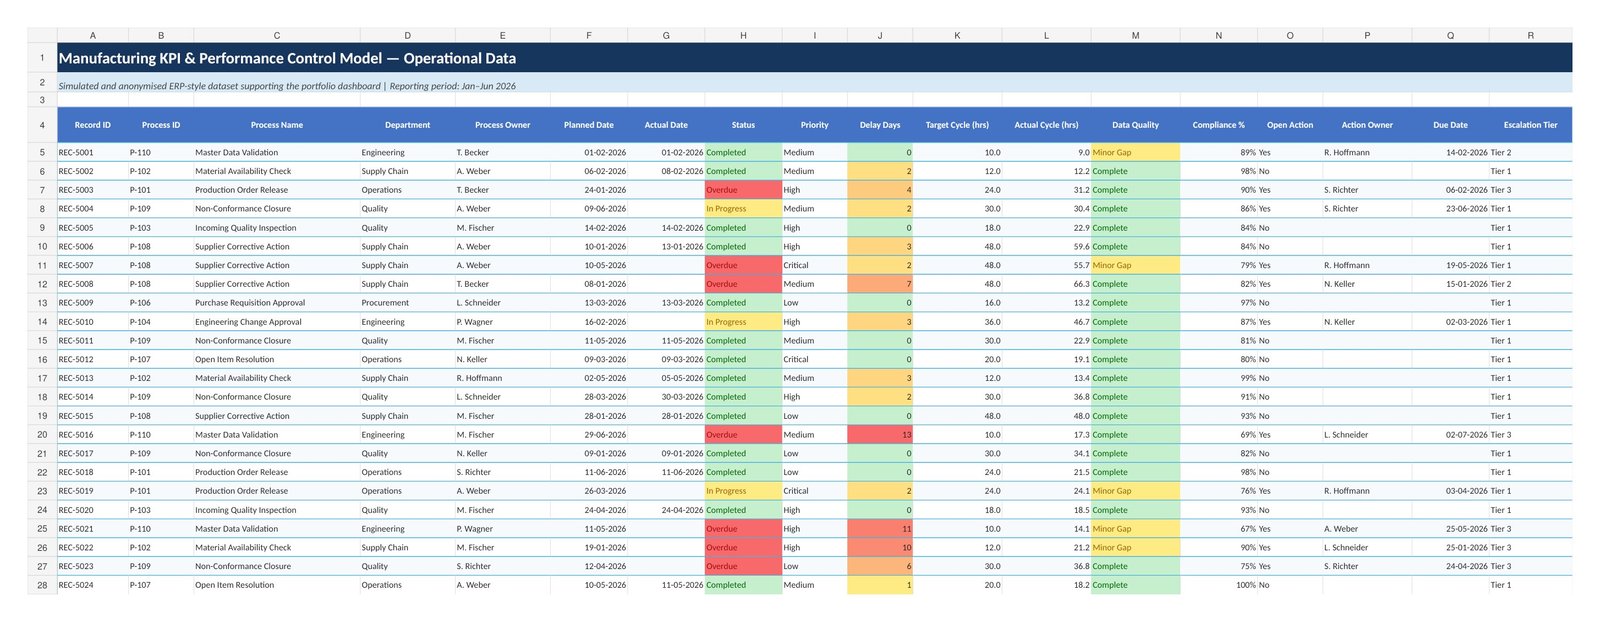
Simulated, anonymised ERP-style operational dataset - 120 records across ten processes, reporting period Jan–Jun 2026.
KEY FIELDS TRACKED
Process
Owner
Planned vs Actual Date
Delay Days
Target Cycle Time
Actual Cycle Time
Compliance %
Open Action
Action Owner
Escalation Tier
Clean, structured, and timely data is the first step toward control.
05 / 10
KPI CATALOGUE & OWNERSHIP
A KPI catalogue prevents interpretation drift.
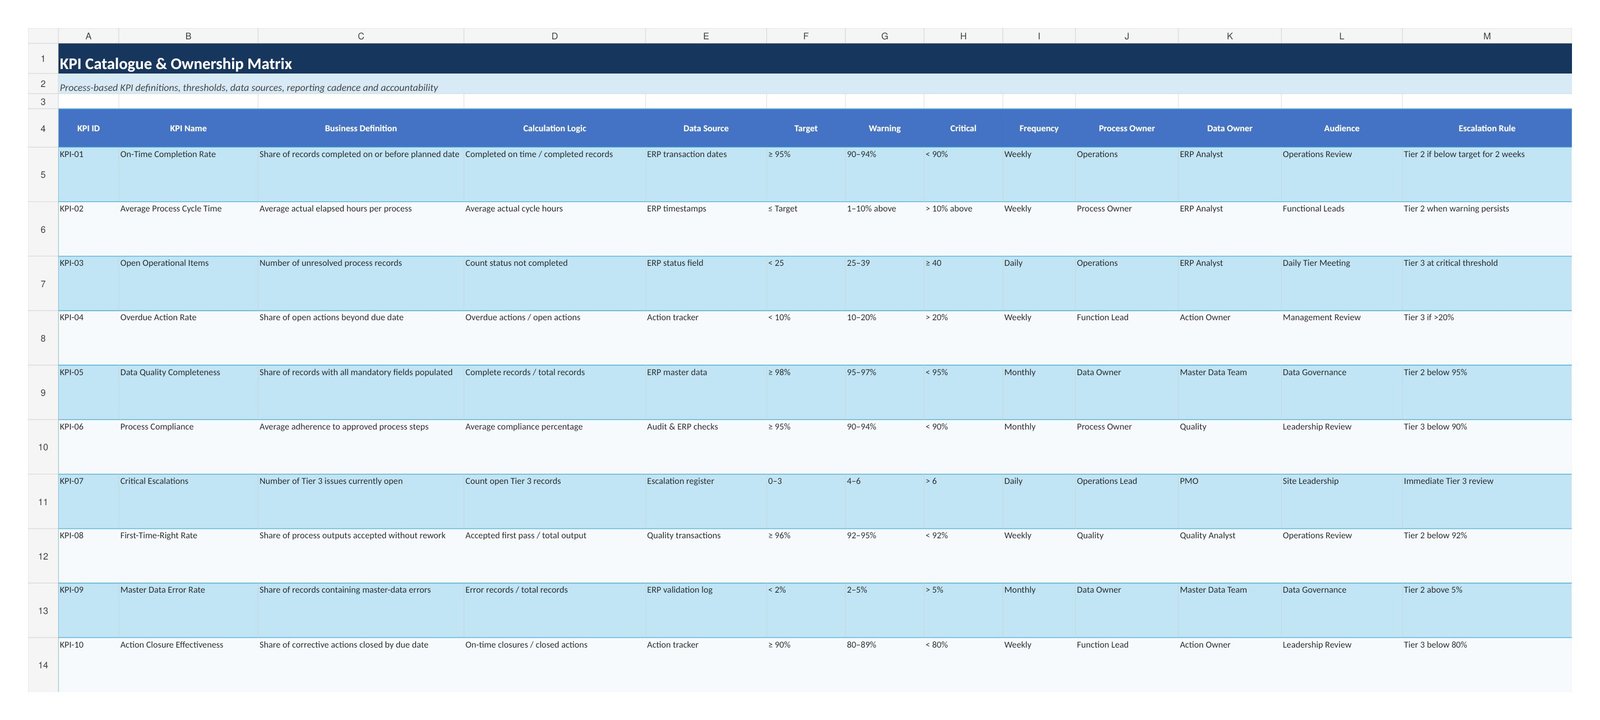
Ten KPIs spanning leading, process and outcome layers - the control constitution referenced by every dashboard and management review.
THE CATALOGUE DEFINES
Business definition
Calculation logic
Data source
Target
Warning threshold
Critical threshold
Frequency
Process owner
Data owner
Audience
Escalation rule
Clear KPI. One definition. One owner. One rule.
06 / 10
PROCESS FLOW & GOVERNANCE
Traceability from workflow to management action.
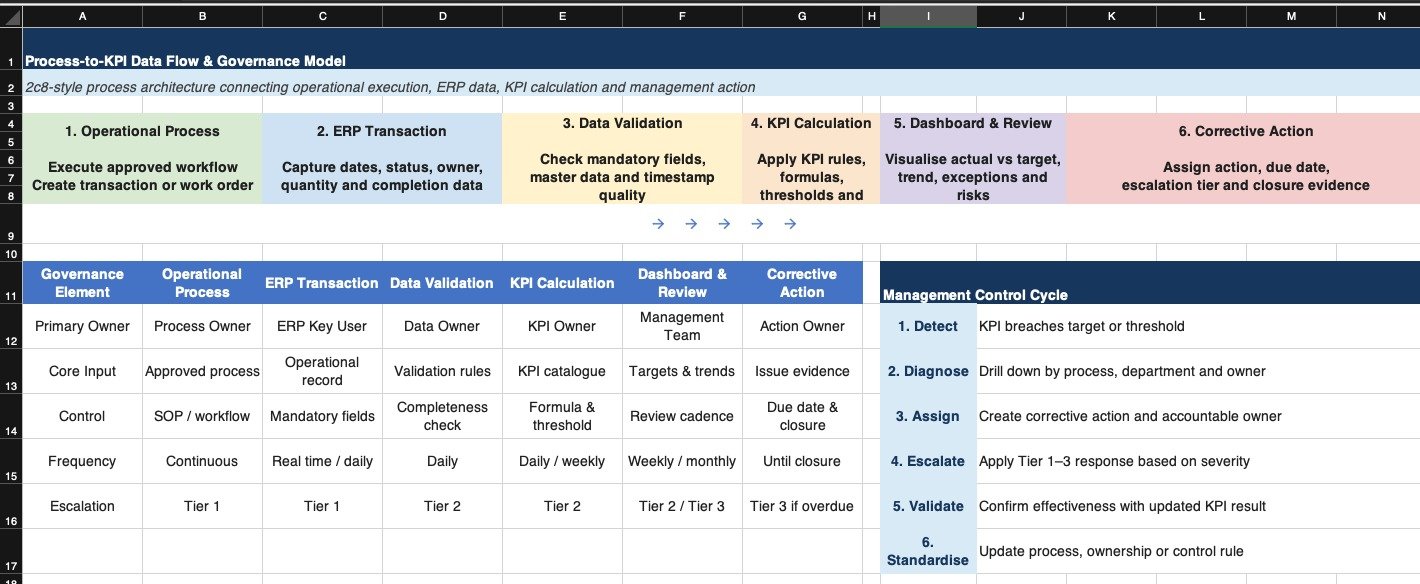
Six-stage process-to-KPI data path, paired with a governance ownership matrix and the management control cycle.
RESPONSIBILITY PROGRESSION
Process Owner
Owns the process and ensures execution.
ERP Key User
Manages ERP data capture and accuracy.
Data Owner
Ensures validation rules and data quality.
KPI Owner
Defines metrics and maintains the catalogue.
Management Team
Reviews trends, exceptions, and risks.
Action Owner
Executes corrective actions and closes the loop.
Every KPI breach should produce one owner, one due date, and one escalation route.
07 / 10
DASHBOARD VIEW
When the system is defined, visibility becomes meaningful.
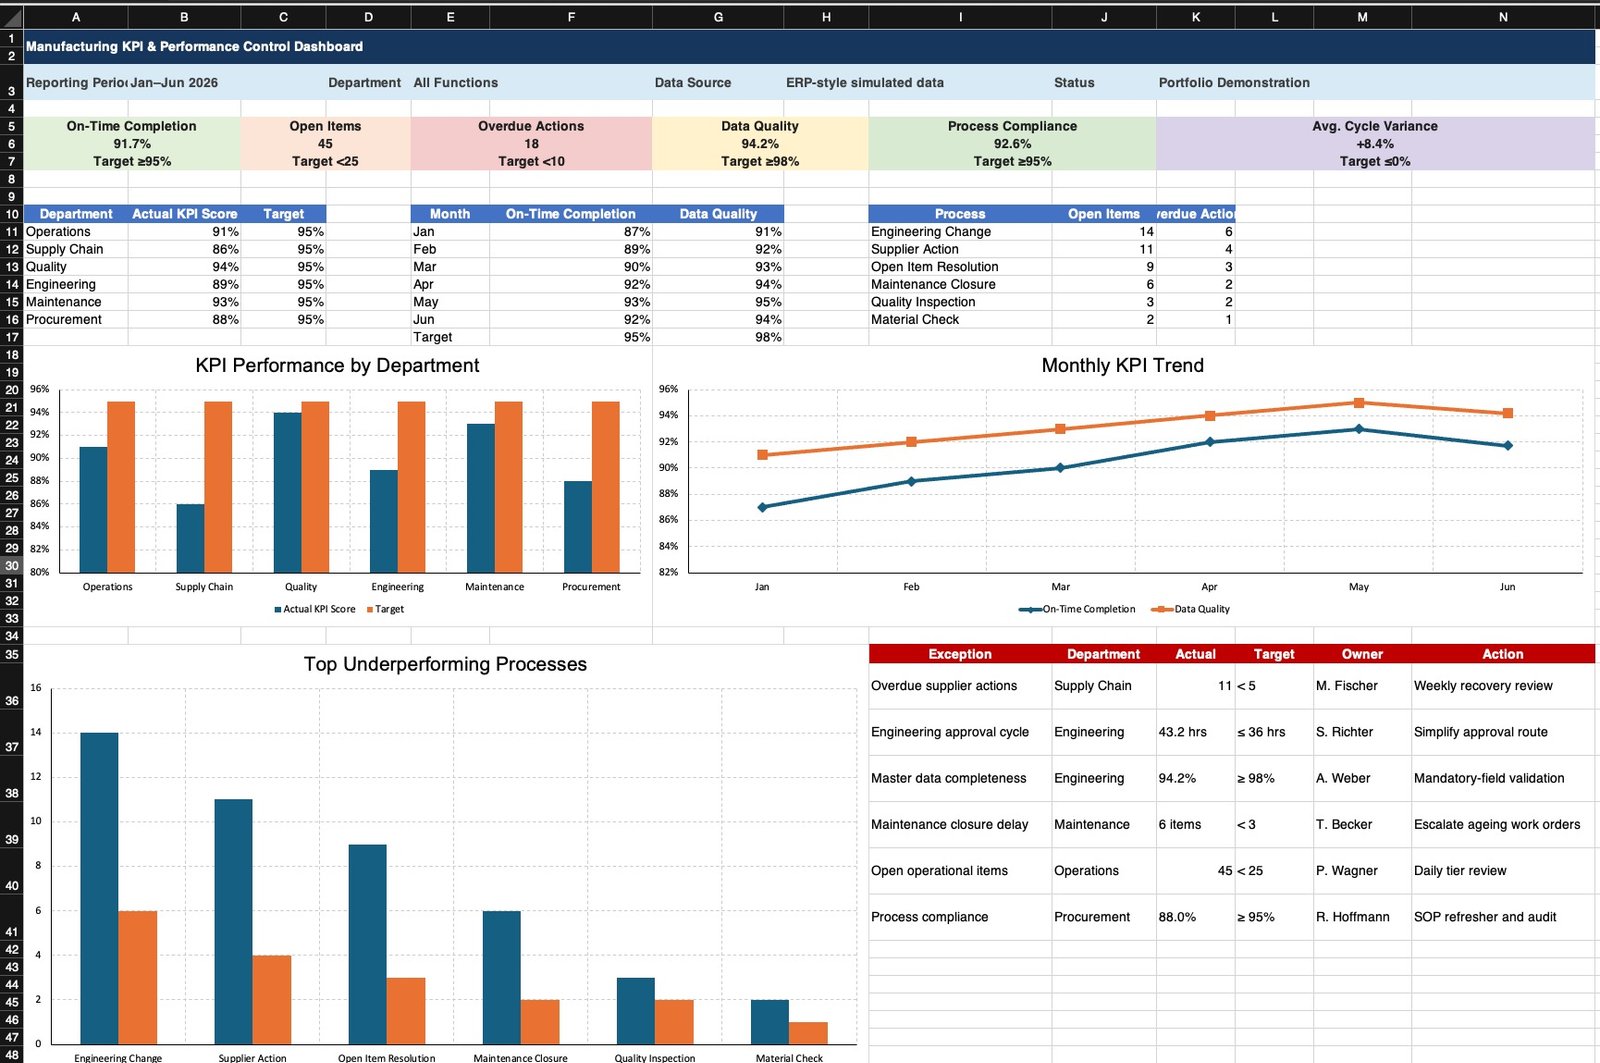
Reporting period Jan–Jun 2026 · On-Time Completion 91.7% (target ≥95%) · Data Quality 94.2% (target ≥98%) · 45 open items (target <25).
MANAGEMENT QUESTIONS THIS DASHBOARD SHOULD ANSWER
Which process is under target?
Where are open items accumulating?
Which actions are overdue?
Where is data quality weakening?
Which process needs escalation?
Daily operational review
Monitor open items, overdue actions, and data breaches.
Weekly functional review
Review trend, exceptions, and Tier 2 escalations.
Monthly leadership review
Assess performance, risks, and improvement initiatives.
Corrective-action follow-up
Confirm closure, standardisation, and effectiveness.
⌄
Next - where this approach creates value
The following section explains the real situations where this framework helps teams create measurable value.
08 / 10
08 · WHERE THIS CREATES VALUE
Where this approach creates value.
This model is most useful when operational activity is complex, cross-functional and difficult to govern through disconnected reports. It helps teams translate scattered process data into accountable action, clear thresholds and review discipline.
01
Process delays & ageing
Useful when approvals, closures or follow-ups begin slipping without clear visibility.
02
Data-quality instability
Helps surface incomplete, inconsistent or unreliable records before decisions are made on weak data.
03
Ownership confusion
Clarifies who owns the KPI, who owns the data, and who must respond when thresholds are missed.
04
Cross-functional exceptions
Supports issues that move across operations, quality, supply chain, engineering and procurement.
05
Review without follow-up
Turns static reporting into a cadence of review, action, validation and closure.
06
Scaling control across teams
Creates one shared logic for definitions, thresholds, escalation and governance across functions.
The strength of the model is not only measurement. It is the discipline it creates after measurement.
09 / 10
09 · SITUATIONS THIS SOLVES
Situations this framework helps solve.
The framework can be applied whenever leadership needs clearer control over process performance, KPI behaviour, overdue actions and management response. It is especially useful when activity is visible in ERP or operational systems but decision-making remains fragmented.
01
Manufacturing operations reviews
When teams need one structured view of on-time completion, open items, process compliance and action closure across departments.
02
Supplier & quality follow-up
When delayed approvals, overdue corrective actions or repeat exceptions need stronger ownership and escalation discipline.
03
Process-improvement governance
When improvement actions are discussed frequently but not consistently validated through measurable KPI movement.
04
Leadership exception management
When managers need to know where performance is below threshold, which risks are ageing, and where intervention is required first.
What this project ultimately helps teams do
See the process clearly
Turn scattered operational activity into one structured view of how work moves, where it delays, and why.
Define the KPI correctly
Build KPI logic that reflects real work, uses reliable data, and supports fair, consistent measurement.
Assign action with ownership
Route actions to the right owner with clear expectations, due dates and escalation paths.
Close the loop with evidence
Validate outcomes, update records, and confirm improvement with measurable KPI movement.
A KPI is only useful when it changes behaviour. This framework turns reporting into response, and response into controlled improvement.
10 / 10
CREDIBILITY & SCOPE
Industrial-academic portfolio project
Built from real industrial operations exposure at Kraftblock and MBA internship work. Confidential Kraftblock data, customer names, supplier information and internal screenshots are not published without approval - any numerical business-improvement claim is used only where explicitly supported by the final internship thesis or company-approved evidence. The KPI catalogue, operational data register, process-governance model and dashboard shown above use an anonymised, simulated dataset built for this portfolio; they are not measured results from a live Kraftblock system.
Go beyond the overview. Explore the complete project documentation, process, and supporting files on GitHub.