Designing a launch-control system that connects suppliers, readiness, tooling, capacity, quality and validation into one measurable ramp to volume.
36
Supplier partners
80.0%+
On-time shipments
8
High-risk mono parts
16
PPAP-approved
7
Go-live gate plan
Engagement across cells, casing, closure and component partners to accelerate readiness, reduce risk and create a repeatable path to volume.
Reference cell
01
The problem behind every battery launch
Battery ramp-up is fail-fast because of one weak link. Our framework reduces risk through seven connected gates.
Disconnected readiness
Every function owns a piece. No single source of truth.
Approved but not effective
Commitments exist, but execution gaps create variability.
Hidden risks
Parts, process or tooling risks surface too late.
Low visibility
Reactive status checks lead to late fixes.
Critical to launch
A delay in one link compromises cost, yield and energy.
01
02
OUR SOLUTION
A launch-control system, not just a tracker
We built a system that connects all critical levers to a shared readiness plan—so decisions are earlier, corrective actions are automatic and risk is contained.
—
One readiness model
Unified gate definition across functions, synced to suppliers.
—
Seven-gate roadmap
Stage-gated plan with entry/exit conditions.
—
Risk & mitigation built in
Proactive risk scoring, triggers and CAPA on every gate.
—
Real-time live improvements
Every gate tracked, issues surfaced early.
—
Capacity verified by data
Live capacity assessment for demand and ramp scenarios.
02
03
The seven-gate launch roadmap
A structured path from concept freeze to scalable volume.
01
Design Freeze
Requirements locked in
02
Supplier Qualification
Capability & compliance validated
03
Tooling Readiness
Tool build & tryout sign-off
04
Pilot Build
Initial build & process proven
05
Validation & PPAP
All validation & PPAP completed
06
Yield Stabilisation
Process window lock & yield performance
07
Volume Ramp
Scale-up with stable yield and cost
03
04
Readiness is measured across six critical dimensions
A single rollup score tracks the real readiness level and highlights the lowest-scoring areas.
Tooling readiness25%
Capacity verified25%
Quality control20%
Material readiness15%
Validation progress10%
PPAP & documentation5%
READINESS DASHBOARD (SCORE ROLL-UP)
SEE LIVE DASHBOARD
04
05
Focus on what can delay the entire launch
The moment risks show up, all attention locks to them—so impact is eliminated, not just recorded.
RISK & PRIORITISATION TRACKER (TOP RISKS)
SEE LIVE TRACKER
05
06
What this approach makes possible
Get the real readiness, not just the reported status.
Know where to intervene and why.
Make better go/no-go decisions with confidence.
Protect your timeline, quality and returns.
06
07
Project assets
Core tools, models, frameworks and reports that power this engagement.
PPAP & VA Level Template
Executive Dashboard Template
Readiness Scoring Model (6 Dimensions)
Risk Heat & Action Tracker
Technical & Supplier Report Pack
07
08
Risk should follow criticality, not just the score.
We segment risk by impact and likelihood, then govern it through a simple cadence with clear escalation rules.
Risk matrix (impact × likelihood)
Low likelihood
Medium likelihood
High likelihood
High impact
Tier 2
Tier 1
Tier 1
Medium impact
Tier 3
Tier 2
Tier 1
Low impact
Tier 3
Tier 3
Tier 2
Governance cadence
Daily recovery huddle
Review critical risks, owners, and 24–48h actions.
Twice-weekly supplier review
Track commitments, risks, and evidence updates.
Gate readiness review
Validate PPAP, live tests, and capacity proofs.
Executive escalation
Remove cross-functional blockers and re-prioritise.
Tier 1 - Critical
High impact & medium/high likelihood. Escalate immediately, daily tracking and executive-owned actions.
Tier 2 - Elevated
Medium impact or likelihood. Twice-weekly tracking, mitigation plan with clear due dates.
Tier 3 - Managed
Low impact & low/medium likelihood. Monitor and close through standard cadence, documented and verified.
08
09
FINDINGS & INSIGHTS
What the data and reviews tell us.
Insights from cross-functional reviews and supplier data analysed across seven gates.
01
Overall readiness is moderate, not launch-secure.
Readiness sits at 80.0%. Several critical items are not yet proven at scale.
02
Capacity is the weakest readiness dimension.
Capacity verification and yield stabilisation lag behind all other dimensions.
03
Risk is concentrated in a meaningful minority.
8 high-risk parts and 16 PPAP-approved items require focused attention.
04
PPAP approval is incomplete and uneven.
16 parts approved vs. a longer tail still pending evidence.
05
Readiness must be interpreted with criticality.
Low-visibility issues on critical parts carry more launch risk than high-visibility gaps.
09
10
RECOMMENDATIONS
A phased path to launch control.
Focus on what moves risk, not just what's easy to track.
PHASE 01
Data & ownership baseline
Establish a single source of truth for parts, gates, risks, and commitments.
DELIVERS
Trusted data, clear owners, and visible risk inventory.
PHASE 02
Critical recovery
Attack Tier 1 risks and weakest dimensions with a tight recovery plan.
DELIVERS
Risk reduction, constraint removal and early stability.
PHASE 03
Gate evidence
Close PPAP gaps and complete live tests to generate irrefutable proof.
DELIVERS
Evidence-backed readiness and gate-level confidence.
PHASE 04
Ramp control
Stabilise yield, monitor in real time, and tune the ramp with control limits.
DELIVERS
Predictable ramp, protected timeline, and sustainable performance.
Focus on criticality over just scores.
Make commitments visible and owned.
Close the loop with evidence, not intent.
Decide with data, act with discipline.
10
11
DETAILS & CREDIBILITY
Deliverables
Supplier-readiness workbook (Excel)
Power BI-style dashboard (mock-up)
Ramp-up roadmap and action plan
Risk matrix and escalation framework
Complete project explanation (PDF)
Skills demonstrated
Cross-functional system design
Data modelling & KPI definition
Supplier risk assessment
Readiness scoring & validation
Strategic analysis & communication
Limitations
Simulated and anonymised data
Not connected to live systems
Scope limited to available inputs
Subject to assumptions stated
For portfolio and learning only
Credibility note
This case study uses simulated and anonymised data to demonstrate method, rigour, and communication. It was not produced for, commissioned by, or endorsed by Tesla, Inc. or any named supplier.
11
12
CLOSING
A launch-control system for confident ramp decisions.
When readiness is measured, risk is governed, and evidence is trusted, ramp-up becomes predictable - not risky.
Go beyond the overview. Explore the complete project documentation, process, and supporting files on GitHub.
Thank you for reading.
About this project
An independent case study by SVD using simulated and anonymised data.
Not affiliated with Tesla, Inc. or any named supplier.
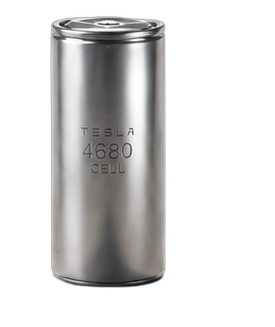 Reference cell