Think and Learn CRM & Sales Performance Intelligence System
Revenue operations, lead scoring and coaching-driven team management.
A high-volume sales environment where thousands of leads moved through the CRM every month. The real challenge was not simply generating activity — it was deciding which leads deserved attention, how quickly the team should act, where revenue was being lost, and how performance could be made more predictable.
Category
Professional project
Period
Dec 2021 – Aug 2023
Progression
Senior BDA → Team Lead → Senior BD Specialist
Core system
LeadSquared CRM
Executive thesis
Converted a high-volume CRM sales operation into a complete revenue-operating system — lead scoring, funnel-leakage analysis, response-time research, coaching-driven team management and scenario-based forecasting, built around a verified ₹1.2 crore-plus result.
₹1.2Cr+
Revenue generated, documented over 11 months
No. 1
Regional rank — Andhra Pradesh & Telangana
7–10
Team members led, coached and developed
~30%
Team output improvement, internal performance tracking
Also received top-performer recognition, including an NS200 motorcycle award.01 / 10
02Business context
A busy pipeline is not the same as a predictable one.
Revenue performance depends on how quickly leads are contacted, how consistently follow-ups are completed, how accurately opportunity stages are maintained, and how clearly managers can see funnel leakage. Activity alone does not guarantee revenue — the system has to decide what deserves attention first.
I progressed through three roles — Senior Business Development Associate, Team Lead, and Senior Business Development Specialist — covering direct sales, customer counselling, CRM discipline, team coordination, weekly reporting, performance coaching, and revenue delivery.
The operating problem I focused on
01
Uneven lead quality
Lead volume was high, but lead quality and intent were uneven.
02
Slow first contact
Slow first contact reduced the chance of conversion.
03
Inconsistent follow-up
Follow-up quality varied between representatives.
04
Unreliable forecast
A busy pipeline did not always produce a reliable forecast.
05
Unfocused coaching
Team activity needed to be converted into focused coaching actions.
The strategic shift: manage revenue as a system of decisions, not a list of targets.
02 / 10
03Approach
From lead to revenue: how I approached the work.
The model is deliberately simple: use the right data, make the next action clear, and create a review rhythm that turns insight into execution.
Operating question
Approach used in the role
Portfolio model created
Which leads need attention first?
Reviewed lead intent, response, ageing, and customer need.
Transparent lead-scoring framework
Where is revenue being lost?
Tracked stage movement, follow-ups, demos, objections, and payment drop-off.
Lead funnel and revenue-leakage model
How should leads be allocated?
Balanced priority, representative capacity, and regional fit.
Smart allocation decision rules
Who needs coaching?
Compared activity, conversion, and revenue contribution.
Team performance and coaching matrix
What revenue is likely to close?
Reviewed pipeline stage, lead quality, and payment confidence.
Base, upside, and downside forecast scenarios
03 / 10
04Strategy reconstruction
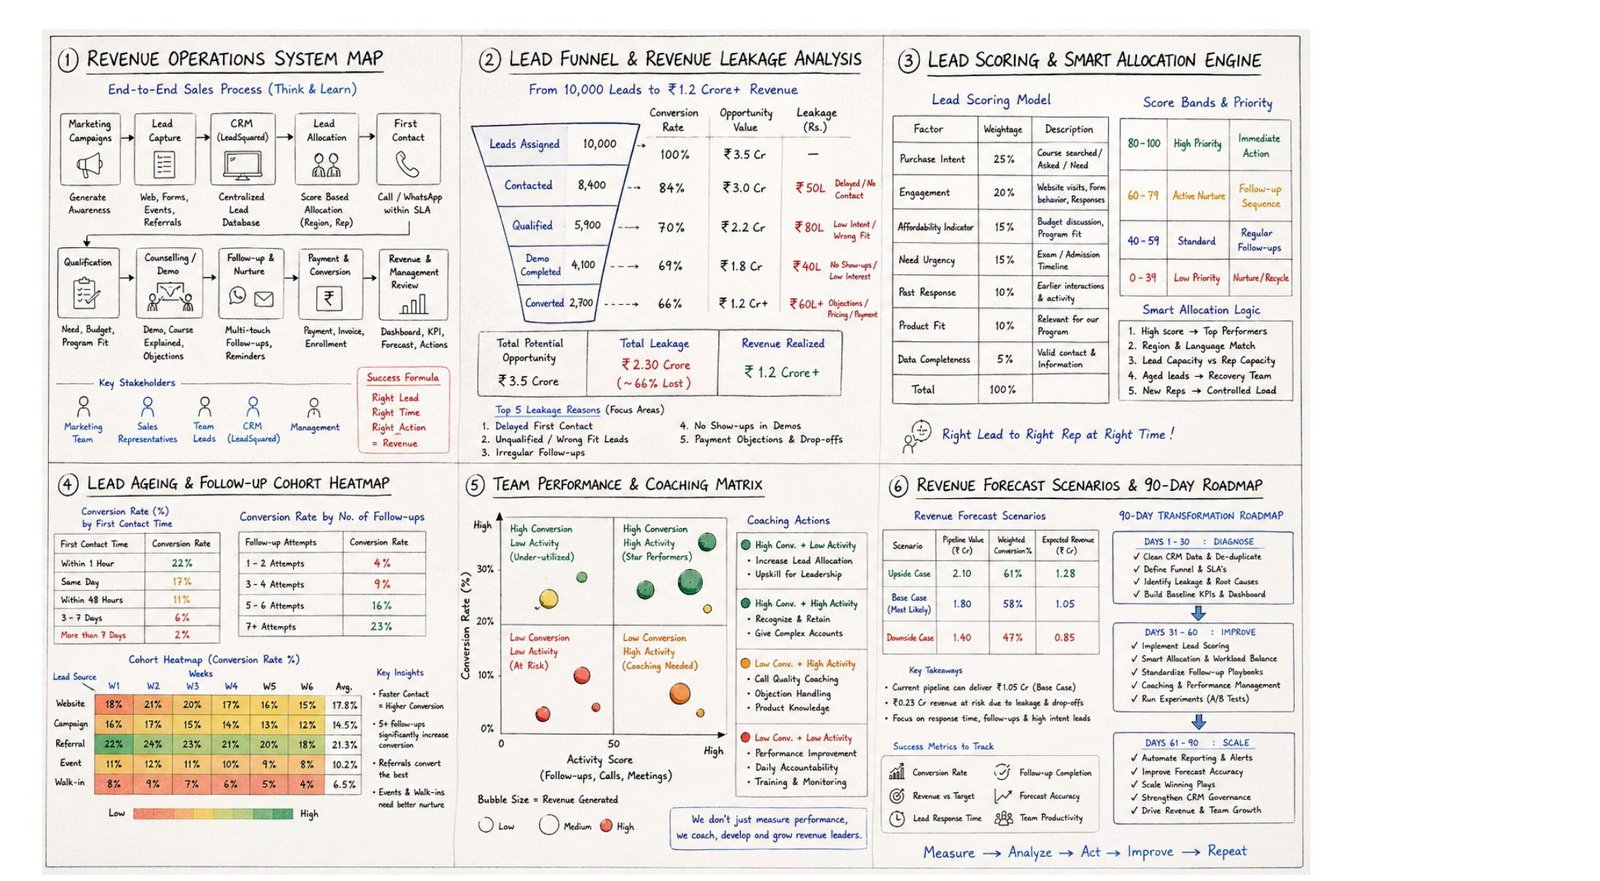
The complete commercial system on one page.
A hand-drawn strategy board connects the funnel, lead scoring, customer response, team coaching, forecasting, and the 90-day operating roadmap into one commercial system.
Reconstructed and anonymised for portfolio use — no confidential customer or company data is shown.
04 / 10
05Commercial analysis
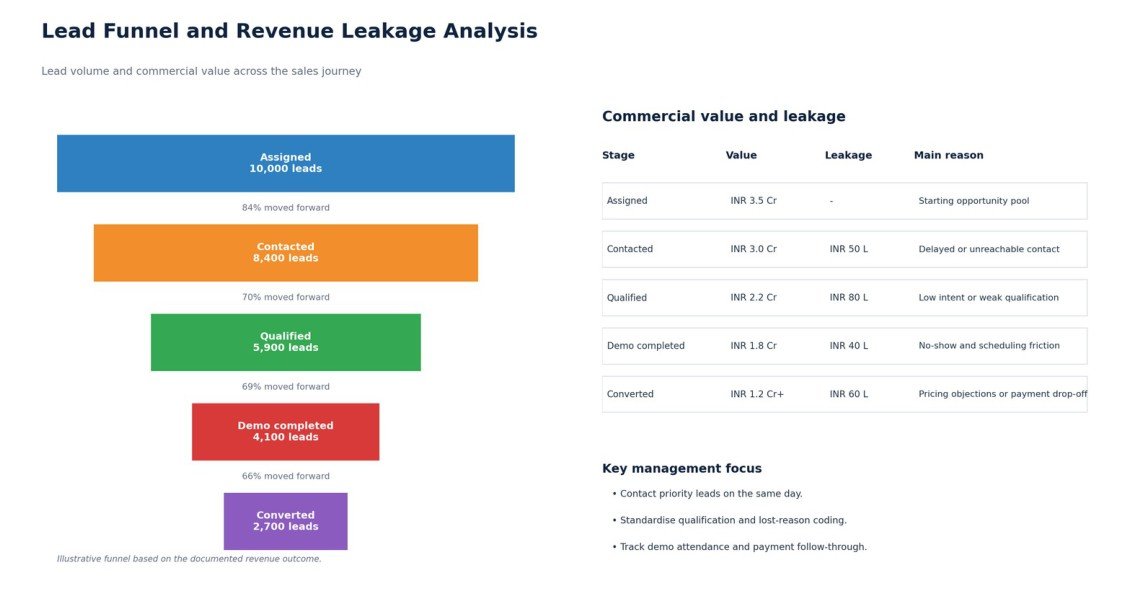
Where did potential revenue actually leak?
Where did potential revenue reduce as leads moved from assignment to contact, qualification, counselling, and payment? The reconstructed funnel is built around the documented INR 1.2 crore-plus result.
Main insight: response speed, qualification quality, demo attendance and payment follow-through are the biggest controllable revenue levers.
05 / 10
06Decision model
Score the lead. Then choose the action.
Not every lead deserves the same urgency, and not every representative should receive the same type of lead. A weighted scoring model makes prioritisation transparent and easier to manage.
25%
Purchase intent
20%
Engagement
15%
Affordability indicator
15%
Need urgency
10%
Past response
10%
Product fit
5%
Data completeness
Score band
Priority
Action
80–100
High priority
Immediate action
60–79
Active nurture
Follow-up sequence
40–59
Standard
Regular follow-ups
0–39
Low priority
Nurture / recycle
Core allocation rules
High-value, high-intent leads go to experienced closers
Regional and language fit improves customer comfort
Fast contact. Structured follow-up. That's the formula.
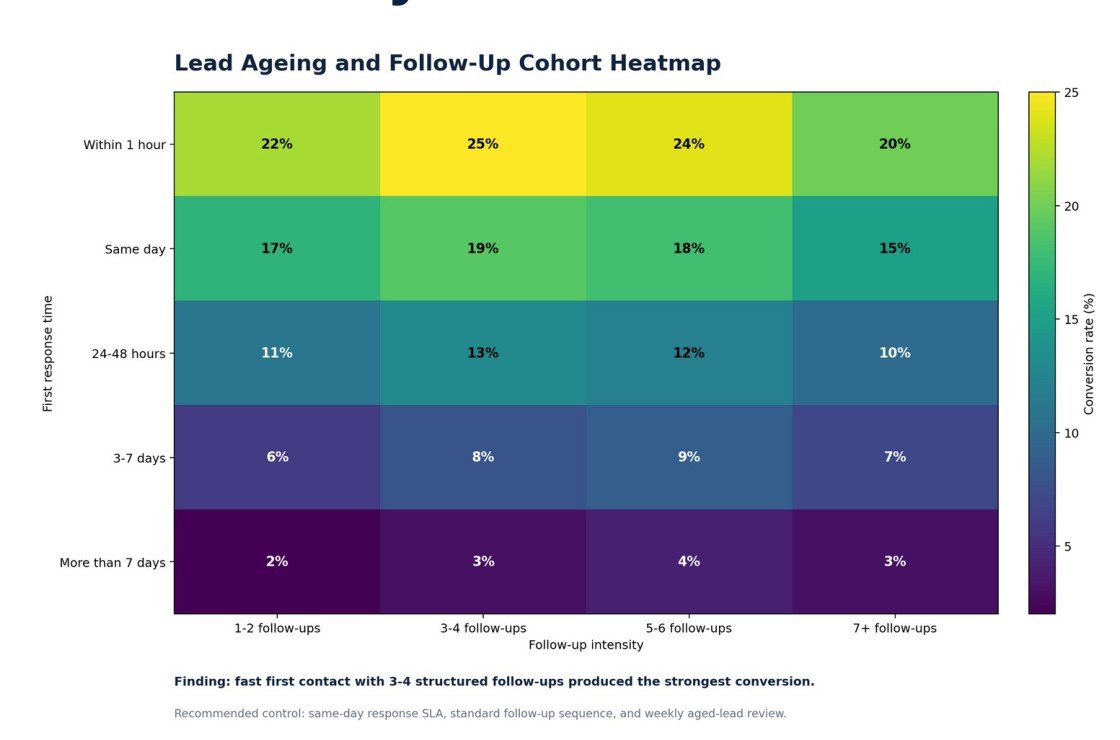
How does conversion change when first contact is delayed, and how much can additional follow-up recover?
Operating hypothesis
Fast first contact improves the chance of a meaningful conversation
A structured sequence is stronger than irregular follow-up
Response time should be treated as a core commercial KPI
Finding: fast first contact combined with 3–4 structured follow-ups produced the strongest conversion.
Recommended control: same-day first-contact SLA, a standard four-step follow-up sequence, and a weekly aged-lead review.
07 / 10
08Leadership and coaching
Coach the pattern, not just the number.
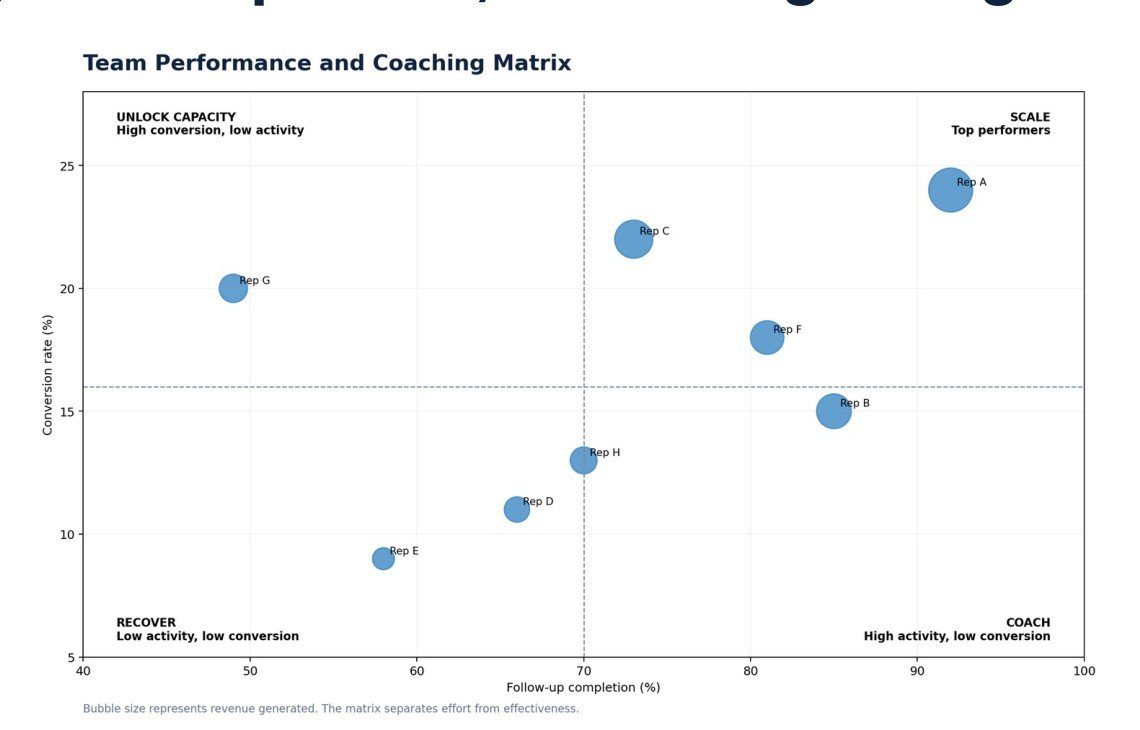
Activity and effectiveness were reviewed separately. This made coaching more specific and helped identify who needed more leads, who needed skill support, and who needed a recovery plan.
Management actions
High activity + high conversion: retain and scale
High activity + low conversion: coach objection handling
Low activity + high conversion: increase allocation
Low activity + low conversion: time-bound recovery plan
Bubble size represents revenue generated. The matrix separates effort from effectiveness.
Observed result: approximately 30% improvement in team output, supported by focused tracking and coaching.08 / 10
09Management control
Turning a pipeline into a forecast leadership can trust.
Scenario
Pipeline value
Weighted conversion
Expected revenue
Upside case
₹2.10 Cr
61%
₹1.28 Cr
Base case (most likely)
₹1.80 Cr
58%
₹1.05 Cr
Downside case
₹1.40 Cr
47%
₹0.85 Cr
Management rhythm: daily huddle on priority leads and blockers · weekly pipeline review of stage movement and coaching · monthly business review of revenue vs target and forecast accuracy.
Success metrics: conversion rate, follow-up completion, revenue vs target, forecast accuracy, lead response time, team productivity.09 / 10
10What this project demonstrates
Tools, credibility and what this shows.
LeadSquared CRMExcelReporting dashboardsPower BI (reconstruction)SQL (reconstruction)Lead scoringRevenue forecastingCoaching frameworks
End-to-end CRM & funnel understanding
Turn scattered CRM activity into one structured view of where revenue moves and where it leaks.
Lead prioritisation & workload design
Scoring logic that reflects real intent and directs the right lead to the right representative.
Coaching with evidence
Separate effort from effectiveness and turn activity data into specific coaching actions.
Forecasting & governance design
Convert pipeline stage and lead quality into base, upside and downside revenue scenarios.
The revenue, ranking, leadership and output figures shown are verified professional results. Any Power BI/SQL layer shown publicly is a reconstruction of the operating model using anonymised or synthetic data — Salesforce was never implemented at Think and Learn (LeadSquared was the real CRM used). No customer names, phone numbers or confidential company exports are published. The strategy board, funnel, scoring, cohort heatmap and coaching matrix visuals are a portfolio reconstruction, not an official company-wide transformation programme.
10 / 10
Go beyond the overview. Explore the complete project documentation, process, and supporting files on GitHub.