Converting route-level demand, utilisation, economics, reliability and strategic network fit into decision-ready service recommendations across 20 European corridors.
Independent recruitment case study using simulated and anonymised route data.01 / 09
01
A busy corridor is not always a strong decision.
Route planning cannot rely on passenger volume alone. Strong demand can still hide weak margins, poor reliability or a network role that requires a different action. This project builds a structured way to see the full picture before committing capacity, so decisions are based on sustainable performance, not assumptions.
Demand vs profitability
High load factors do not guarantee healthy contribution or positive commercial outcomes.
Reliability risk
On-time performance and cancellations can erode customer trust and revenue quality.
Network-fit complexity
Some routes strengthen the network even if their stand-alone margin is modest.
Data-quality distortion
Inconsistent or diluted data can mislead decisions and waste capacity.
02 / 09
02
See the network before changing the service.
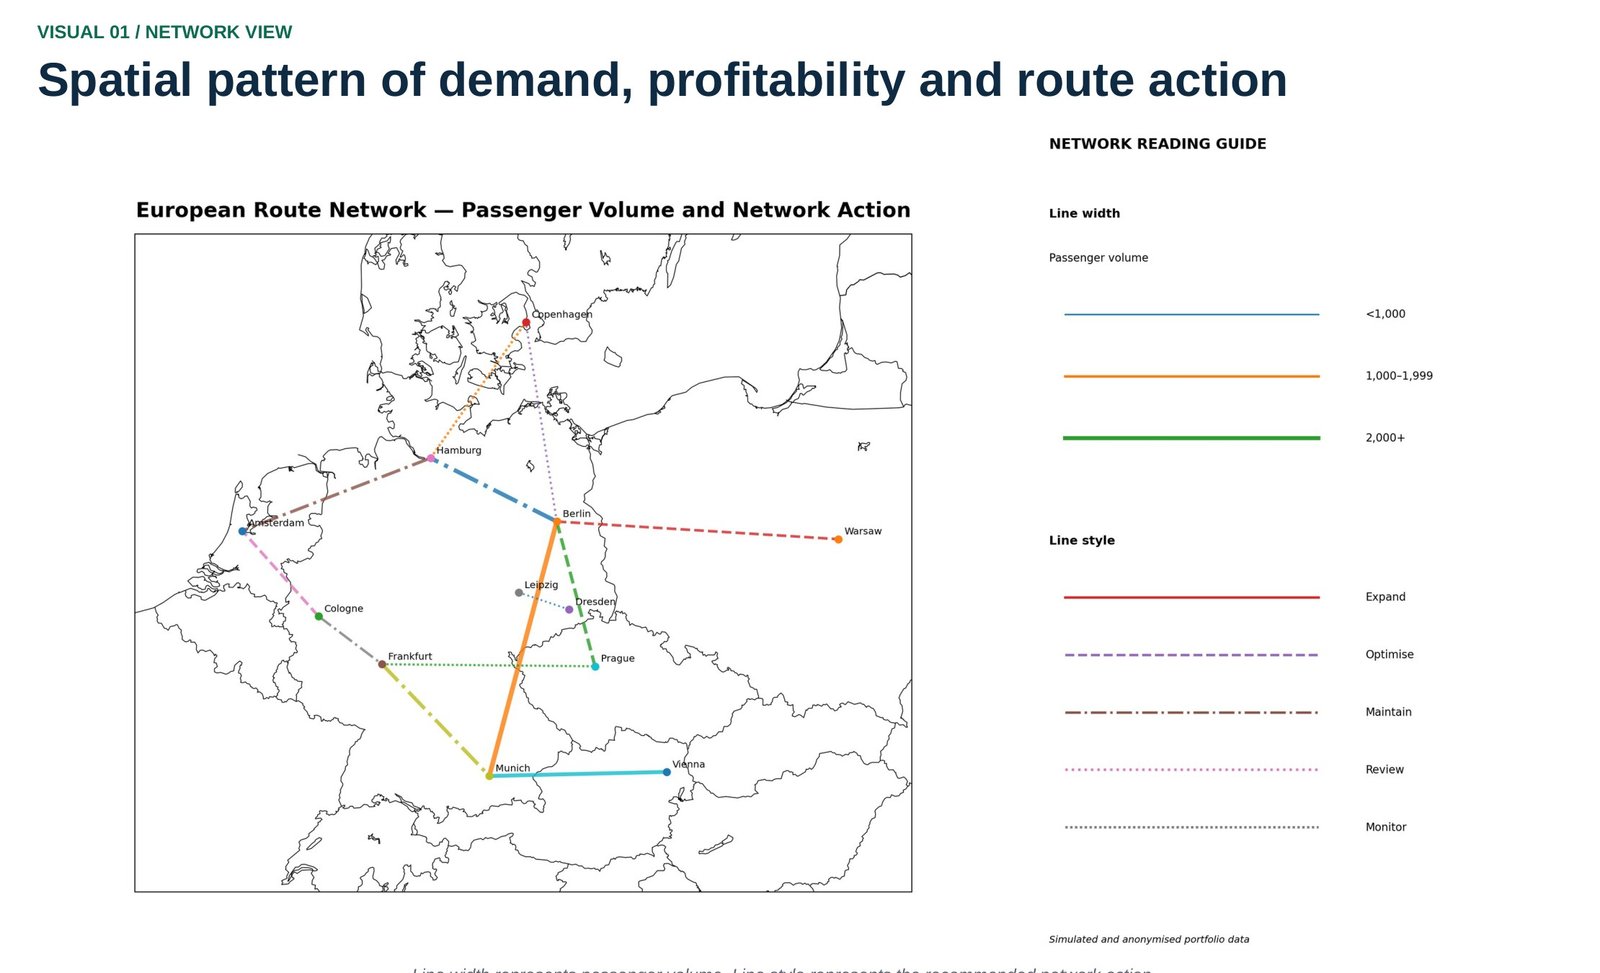
Corridors are not isolated. The project first understands each route in the context of the wider European network. Mapping passenger volume and recommended network action highlights where to expand, optimise, maintain or review - where it creates the most value.
Expand
Optimise
Maintain
Review
Monitor
Line width represents passenger volume; line style represents the recommended network action. Simulated and anonymised portfolio data.
03 / 09
03
Score the route. Then choose the action.
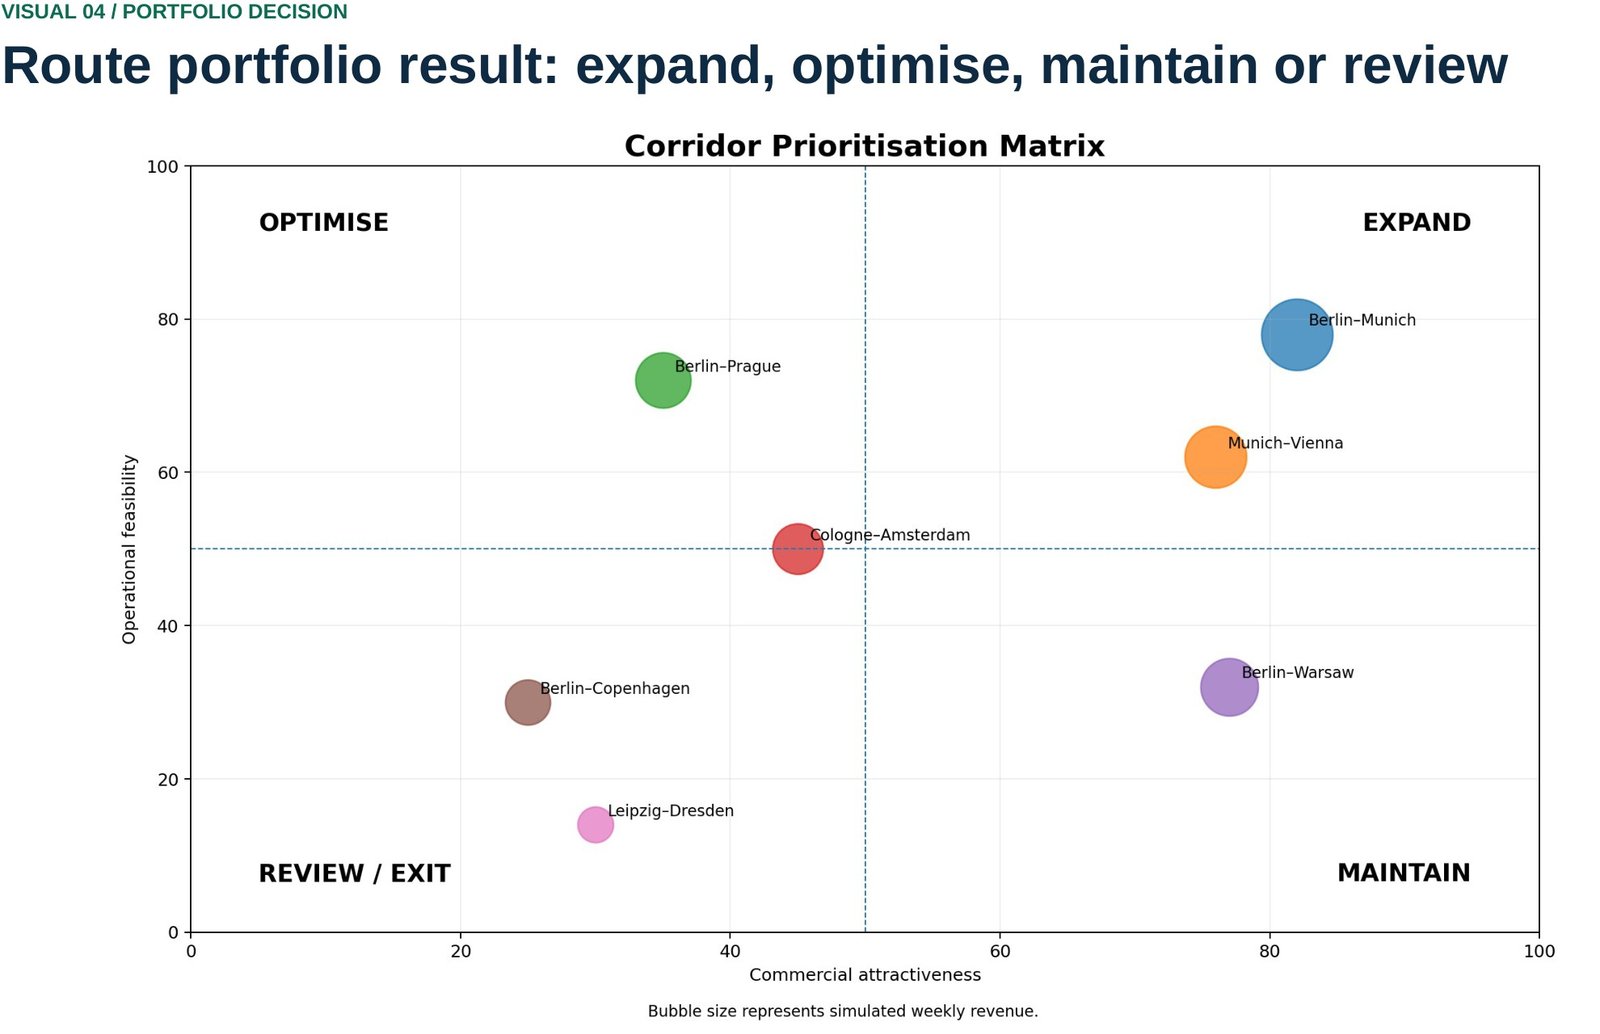
A weighted prioritisation model evaluates each route across five dimensions to identify the strongest candidates for expansion and the routes that need optimisation.
30%
Demand potential
20%
Contribution margin
20%
Operational reliability
15%
Network fit
10%
Execution complexity
Corridor
Demand
Margin
Reliability
Network fit
Score
Recommended action
Berlin–Munich
High
Strong
High
High
4.2
Expand
Munich–Vienna
High
Strong
High
Medium
3.9
Expand
Berlin–Prague
Medium
Medium
Medium
High
3.1
Optimise
Cologne–Amsterdam
Medium
Medium
High
Medium
3.0
Optimise
Berlin–Warsaw
High
Medium
Low
Medium
2.8
Maintain
Berlin–Copenhagen
Low
Weak
Low
Medium
2.1
Review
Leipzig–Dresden
Low
Weak
Low
Low
1.8
Review
Bubble size represents simulated weekly revenue. The axes separate commercial value from execution feasibility.
04 / 09
04
Redesigning the timetable, not just adding capacity.
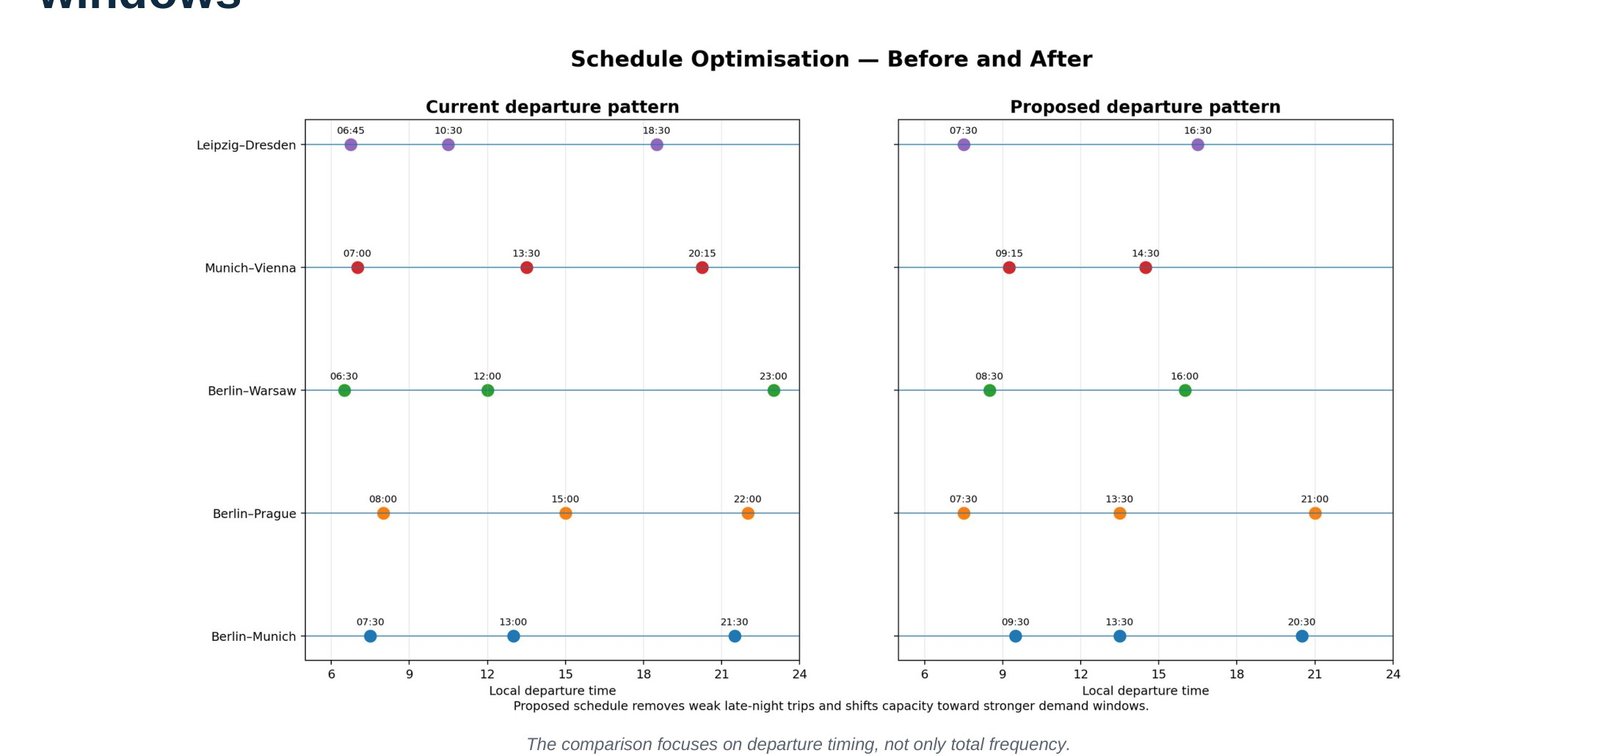
The revised schedule removes weak late-night departures and shifts capacity toward stronger morning, afternoon and weekend demand windows - testing whether better timing can improve utilisation before the network adds more total trips.
Berlin–Munich is used as a sample corridor test - the same model can be extended through to whether additional service justifies added capacity.
23,480
Weekly passengers
81%
Load factor
€619k
Weekly revenue
€207k
Weekly contribution
Route business case - Berlin–Munich
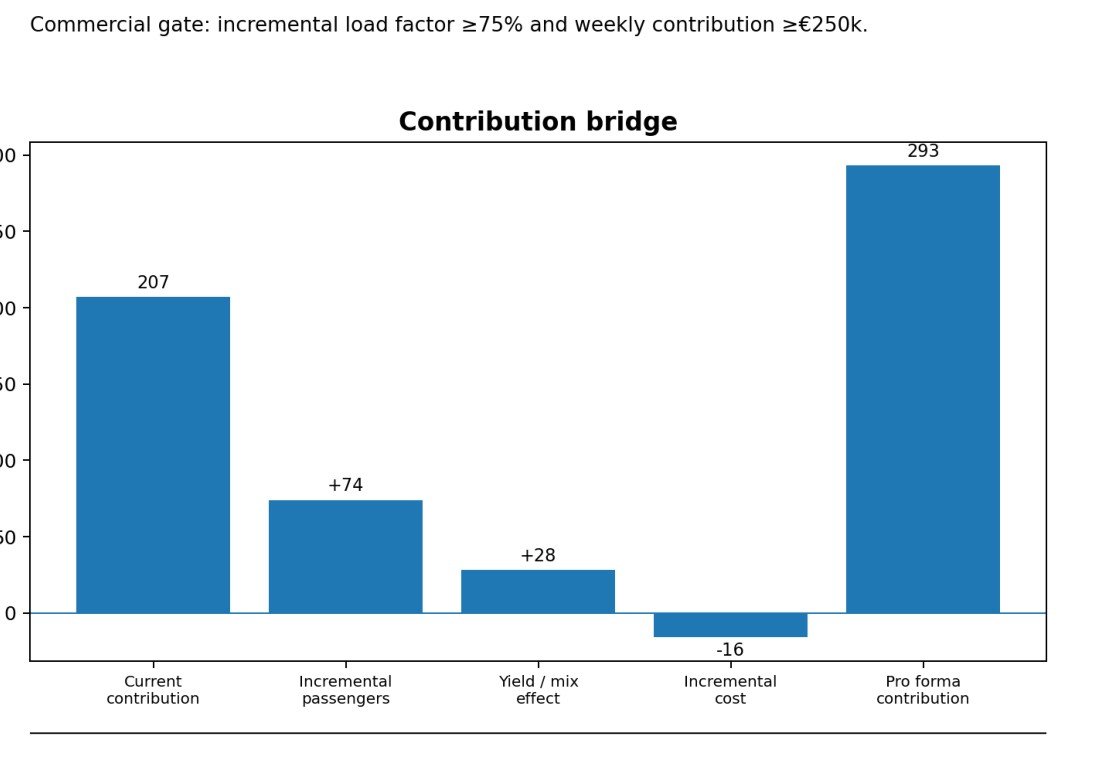
The corridor combines high demand, resilient service quality and strategic fit. The proposal recommends adding two peak departures during Friday and Sunday demand windows. Decision logic: expand only when the pilot confirms load factor and margin thresholds are met.
Simulated and anonymised portfolio data. Commercial gate: incremental load factor ≥75% and weekly contribution ≥€250k.
Recommendation
Run a four-week pilot with two additional peak departures. Make the change permanent only when incremental load factor stays at or above 75% and weekly contribution reaches at least €250k.
Expected impact
≈ €85k incremental weekly contribution · fewer >90% load events on peak days · stronger connections into Hamburg and Cologne.
Key risks
Vehicle and crew availability, competitive discounting, congestion during peak windows.
06 / 09
06
The decision is only as strong as the data beneath it.
A robust data foundation turns raw operational inputs into visibility and monitoring, enabling exception management and faster, clearer decisions. Each route-week record connects demand, economics, reliability and network context in one structured table.
ROUTE-WEEK DATA FIELDS
Route, corridor and direction
Week, season flag and departure time
Passengers, seat capacity and load factor
Fare, revenue and cost split
Contribution and margin
On-time performance and cancellations
Strategic corridor tag and hub connections
Data-quality flag and review status
07 / 09
07
From analysis to controlled action.
Decisions are tested and phased. Pilots are designed to validate customer value and only scale what works.
Test / action
Corridor
Business question
Gate
Status
Four-week peak departure test
Berlin–Munich
Does added capacity sustain margin?
Load factor ≥75%, contribution ≥€250k/week
Piloted
Two early-morning departures
Munich–Vienna
Does earlier timing lift utilisation without hurting reliability?
On-time performance holds, load factor improves
In progress
Off-peak fare adjustment
Leipzig–Dresden, Berlin–Copenhagen
Can pricing repair weak off-peak utilisation?
Contribution margin improves, no volume loss
Not started
Pilot before permanent change
Small, time-boxed tests reduce risk before real demand is committed.
Protect timetable quality
Reliability and on-time performance are non-negotiable.
Validate commercial outcome
Margin and contribution must improve with the change.
Scale only with evidence
Expand what works, redesign or exit what doesn't.
08 / 09
08
What this project demonstrates
Structured route-level decision-making
From raw data to a decision-ready recommendation.
Weighted prioritisation & scoring
A transparent, repeatable model across five dimensions.
Route economics & contribution modelling
Demand, margin and cost translated into one commercial case.
Pilot-based governance
Measurable gates before any capacity becomes permanent.
One weighted model. Clearer priorities. Stronger network decisions.
09
Independent case study
This project is an independent recruitment case study built using a simulated and anonymised route-week dataset. It was not commissioned by, conducted inside or endorsed by Flix. It shows how route data can be transformed into repeatable, evidence-based decisions across expansion, optimisation, maintenance and review.
Go beyond the overview. Explore the complete project documentation, process, and supporting files on GitHub.