A closed-loop manufacturing operating system that converts production bottlenecks into owned, prioritised and traceable actions - from line-level detection to executive escalation and verified closure.
Type
Independent case study
Domain
EV manufacturing / NPI
Duration
4-week portfolio build
Role
Project creator / analyst
Tools
Excel, Power BI concepts, Pareto, 5 Whys, RACI, OEE / FPY
142
Issues modelled
45
Open / in progress
4
Escalation tiers
83.6%
Action effectiveness
Independent manufacturing strategy portfolio case study using simulated data.01 / 10
01
A dashboard can reveal a problem. It cannot decide who owns it.
During production ramp-up, material shortages, equipment failures, quality defects, supplier delays and process imbalances can spread across several functions. The challenge is not only detecting the issue. The challenge is moving it to the correct decision level, assigning ownership and keeping it open until the countermeasure is verified.
Slow response
Issues are detected but not acted on within the required time.
Unclear ownership
Problems remain in discussion without a single accountable owner.
Repeated losses
Similar issues reappear because root causes are not removed.
Unverified closure
Issues are closed before the corrective action is proven effective.
The operating question is not only:
What happened?
It is:
Who owns the next decision?
02 / 10
02
From production signal to standardised prevention.
The operating system follows a clear loop. Each step has an owner, a purpose and a measurable outcome.
01
Detect
Capture the issue
02
Contain
Stabilise impact
03
Classify
Apply category and tier
04
Assign
Route to the right owner
05
Investigate
Find and verify root cause
06
Correct
Implement permanent action
07
Validate
Confirm results with data
08
Standardise
Update controls and prevent repeat
Every issue remains traceable from first signal to verified closure and standardisation.
03 / 10
03
One issue. One record. One accountable owner.
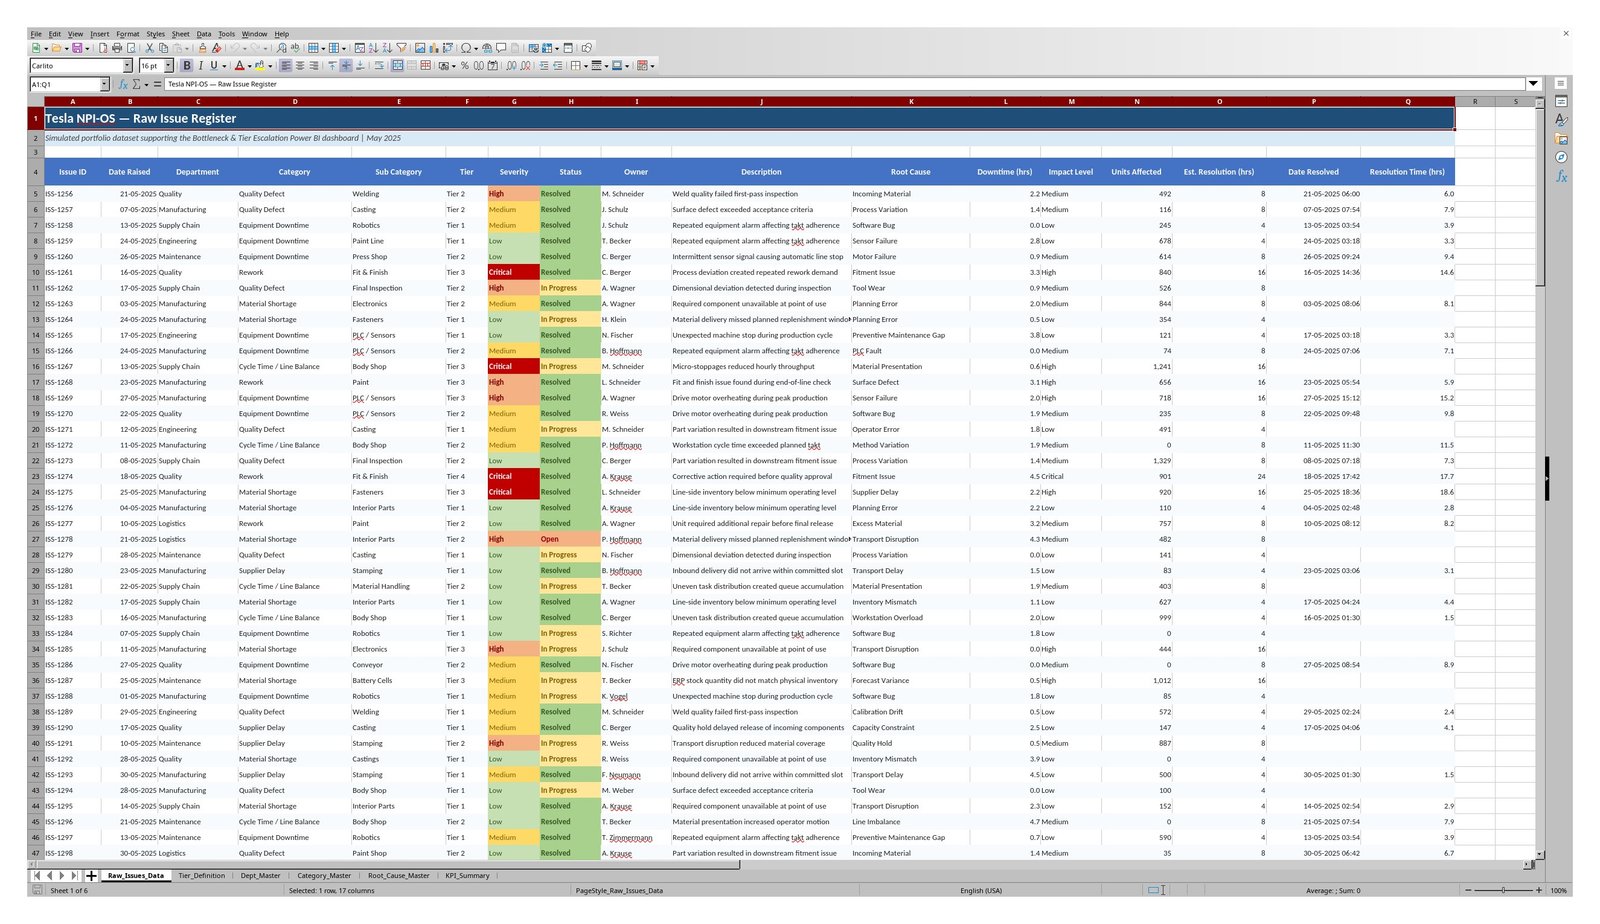
The data foundation begins with one structured record per issue. Each record connects the event, department, category, tier, status, owner, root cause, downtime, production impact, resolution timing and closure evidence.
Standardised fields
Consistent data across all functions.
Impact and tier logic
Issues classified by impact and urgency.
Clear owner tracking
Accountability is visible from day one.
Resolution and ageing control
Time-to-resolve and overdue risk are measurable.
Actual spreadsheet render of the simulated issue register used as the dashboard data source.
04 / 10
04
See the factory. Decide where to intervene.
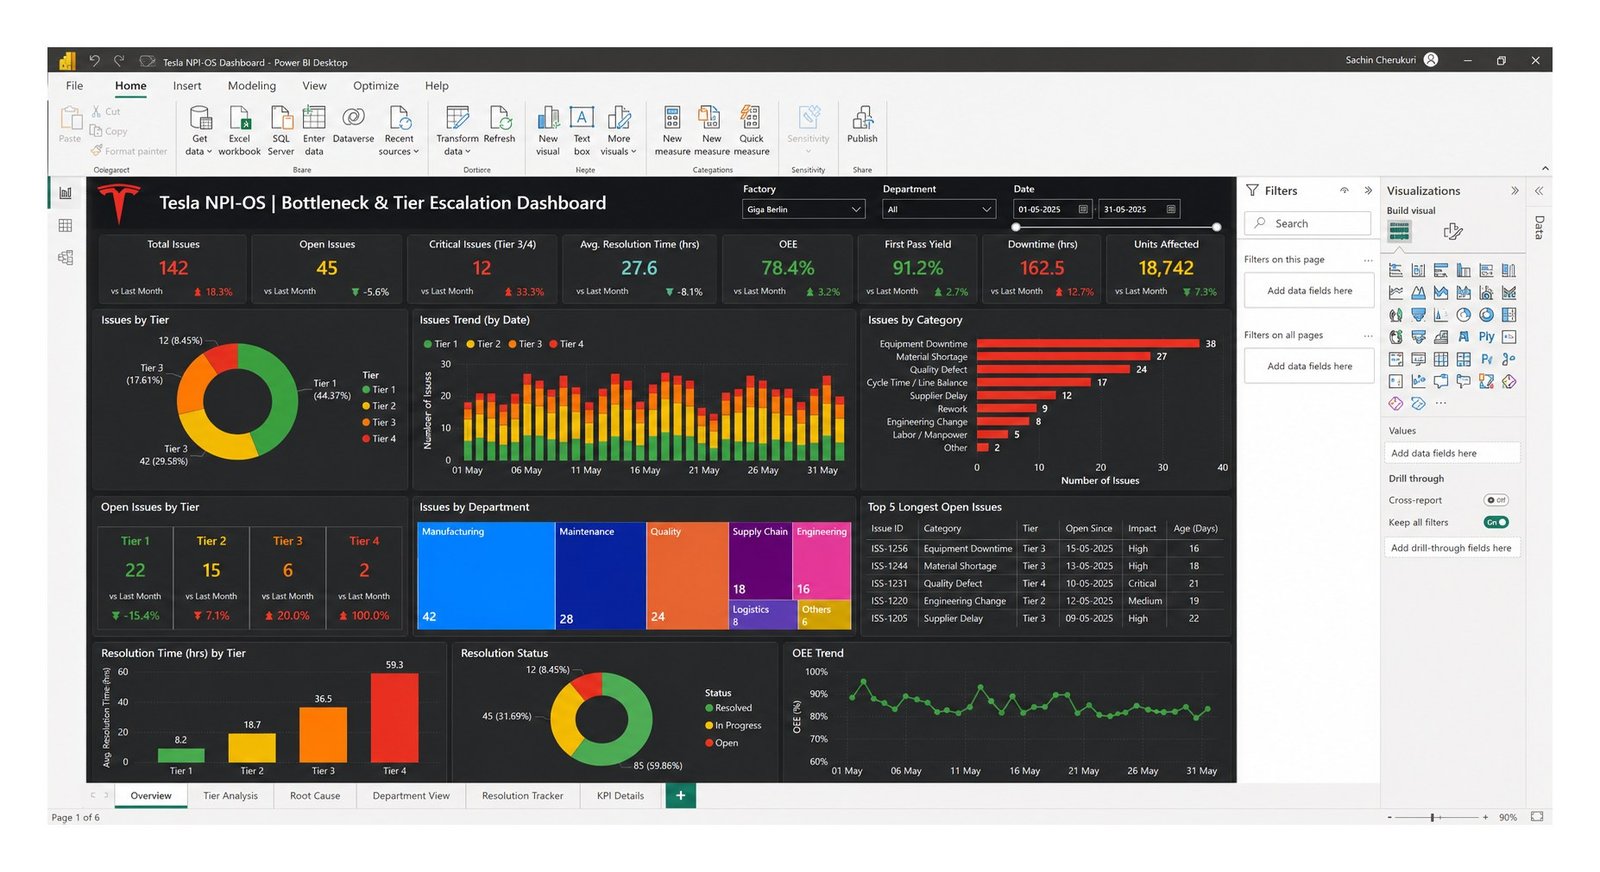
The executive view translates issue records into management visibility across issue load, escalation level, category, department, ageing, downtime, OEE, first-pass yield and ownership.
Where is production loss highest?
Are Tier 3 and Tier 4 issues increasing?
Which functions own the highest risks?
Which open issues are beyond target?
Where should leadership intervene first?
Power BI-style portfolio mock-up. Values are tied to the simulated Excel issue register.
05 / 10
05
From visible symptoms to verified prevention.
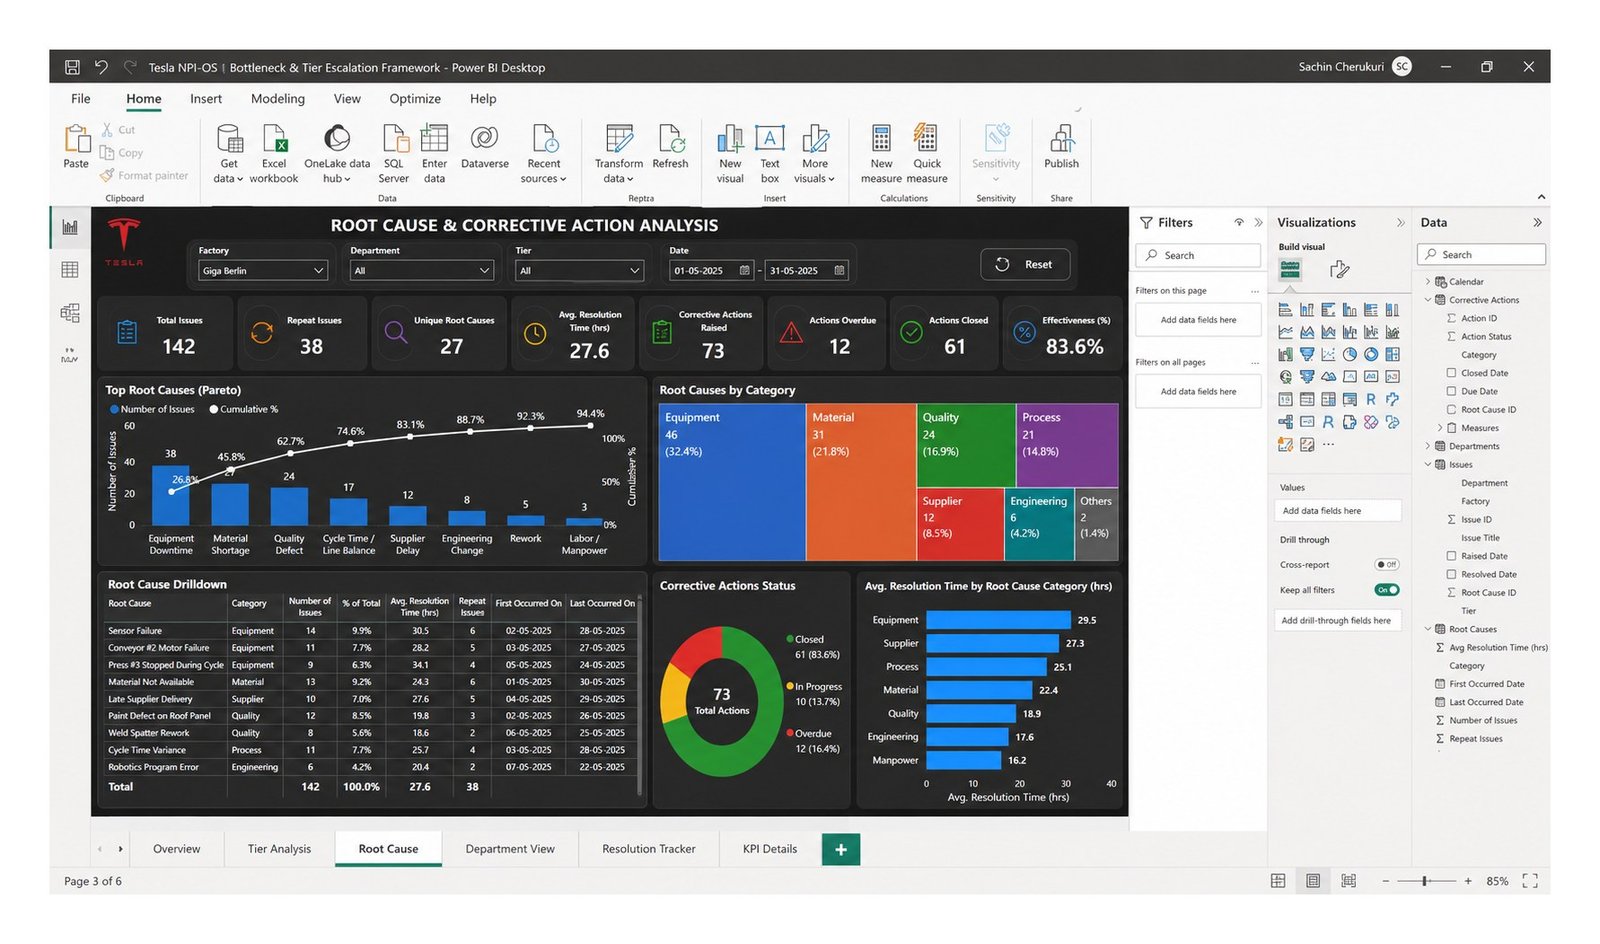
The analysis moves from category-level disruption into specific root causes, repeat frequency, first and last occurrence, corrective-action status, average resolution time and effectiveness.
Resolved means production recovered.
Closed means the cause was removed, the action worked and prevention was standardised.
Pareto focus
Prioritise the vital few causes.
Corrective-action tracking
Monitor actions to closure and validation.
Resolution time
Measure how long it takes to remove the root cause.
Repeat issue control
Escalate recurrence and reopen ineffective actions.
Root-cause and corrective-action dashboard mock-up using the same simulated issue population.
06 / 10
06
Governance & decision rhythm
The dashboard works only when decisions happen on time.
Hourly / Shift
Contain local abnormality and restore safe flow.
Daily Tier 2 review
Remove technical blockers and manage ageing.
Daily Tier 3 review
Protect output, quality, launch and supplier continuity.
Weekly performance review
Review trends, repeat loss and action effectiveness.
Monthly governance
Address structural risks, capacity, supplier and standardisation.
MANAGEMENT CONTROLS
Ageing is reviewed against tier-specific response targets.
Repeat issues cannot be closed as isolated events.
Critical issues require daily status and recovery confidence.
Overdue actions move to the next review level.
Lessons learned become standard work or control updates.
07 / 10
07
What the model reveals
01
Equipment, quality and material losses dominate the issue population.
Create focused loss-elimination workstreams with category owners and weekly Pareto review.
02
45 issues remain open or in progress.
Use tier-specific response targets, top-ageing visibility and owner workload tracking.
03
Higher-tier issues require decision authority, not just faster meetings.
Define explicit Tier 3 and Tier 4 triggers and the expected leadership decision.
04
Closure alone does not prove process stability.
Track repeat rate, action effectiveness and standardisation evidence.
08 / 10
08
Implementation roadmap
How the concept could become a live factory-control system
1. Define
Taxonomy, tiers, ownership
2. Build data
Issue register and master data
3. Implement measures
Ageing, OEE, FPY, effectiveness
4. Configure workflow & reviews
Dashboards, alerts, cadence
5. Pilot & improve
Test, calibrate and refine
RISKS AND LIMITATIONS
Synthetic data cannot reproduce the full complexity of a live factory.
Dashboard images are mock-ups; a native build is required for true interactivity.
Illustrative thresholds require real process calibration.
RECOMMENDED NEXT-LEVEL ENHANCEMENTS
Add a dedicated action table and effectiveness-validation fields.
Add overdue escalation logic for critical blockers.
Create drill-through views for owner, supplier and repeat cause.
Pilot the workflow in a small line scenario.
09 / 10
09
What this project demonstrates
Structured manufacturing problem solving
From detection to verified prevention.
Data model & KPI architecture
Fit-for-purpose data that drives decisions.
Escalation and decision-right design
The right issue to the right owner at the right tier.
Root-cause and corrective-action governance
Close the loop and prevent recurrence.
One structured loop. Faster decisions. Stronger execution.
10
Independent case study
This project is an independent manufacturing strategy portfolio case study built using simulated data. It was not commissioned by, conducted inside or endorsed by Tesla. Dashboard visuals are portfolio mock-ups; the Excel issue register is a real generated workbook using simulated records.
Go beyond the overview. Explore the complete project documentation, process, and supporting files on GitHub.